A comprehensive system for turning data into actions that drive results
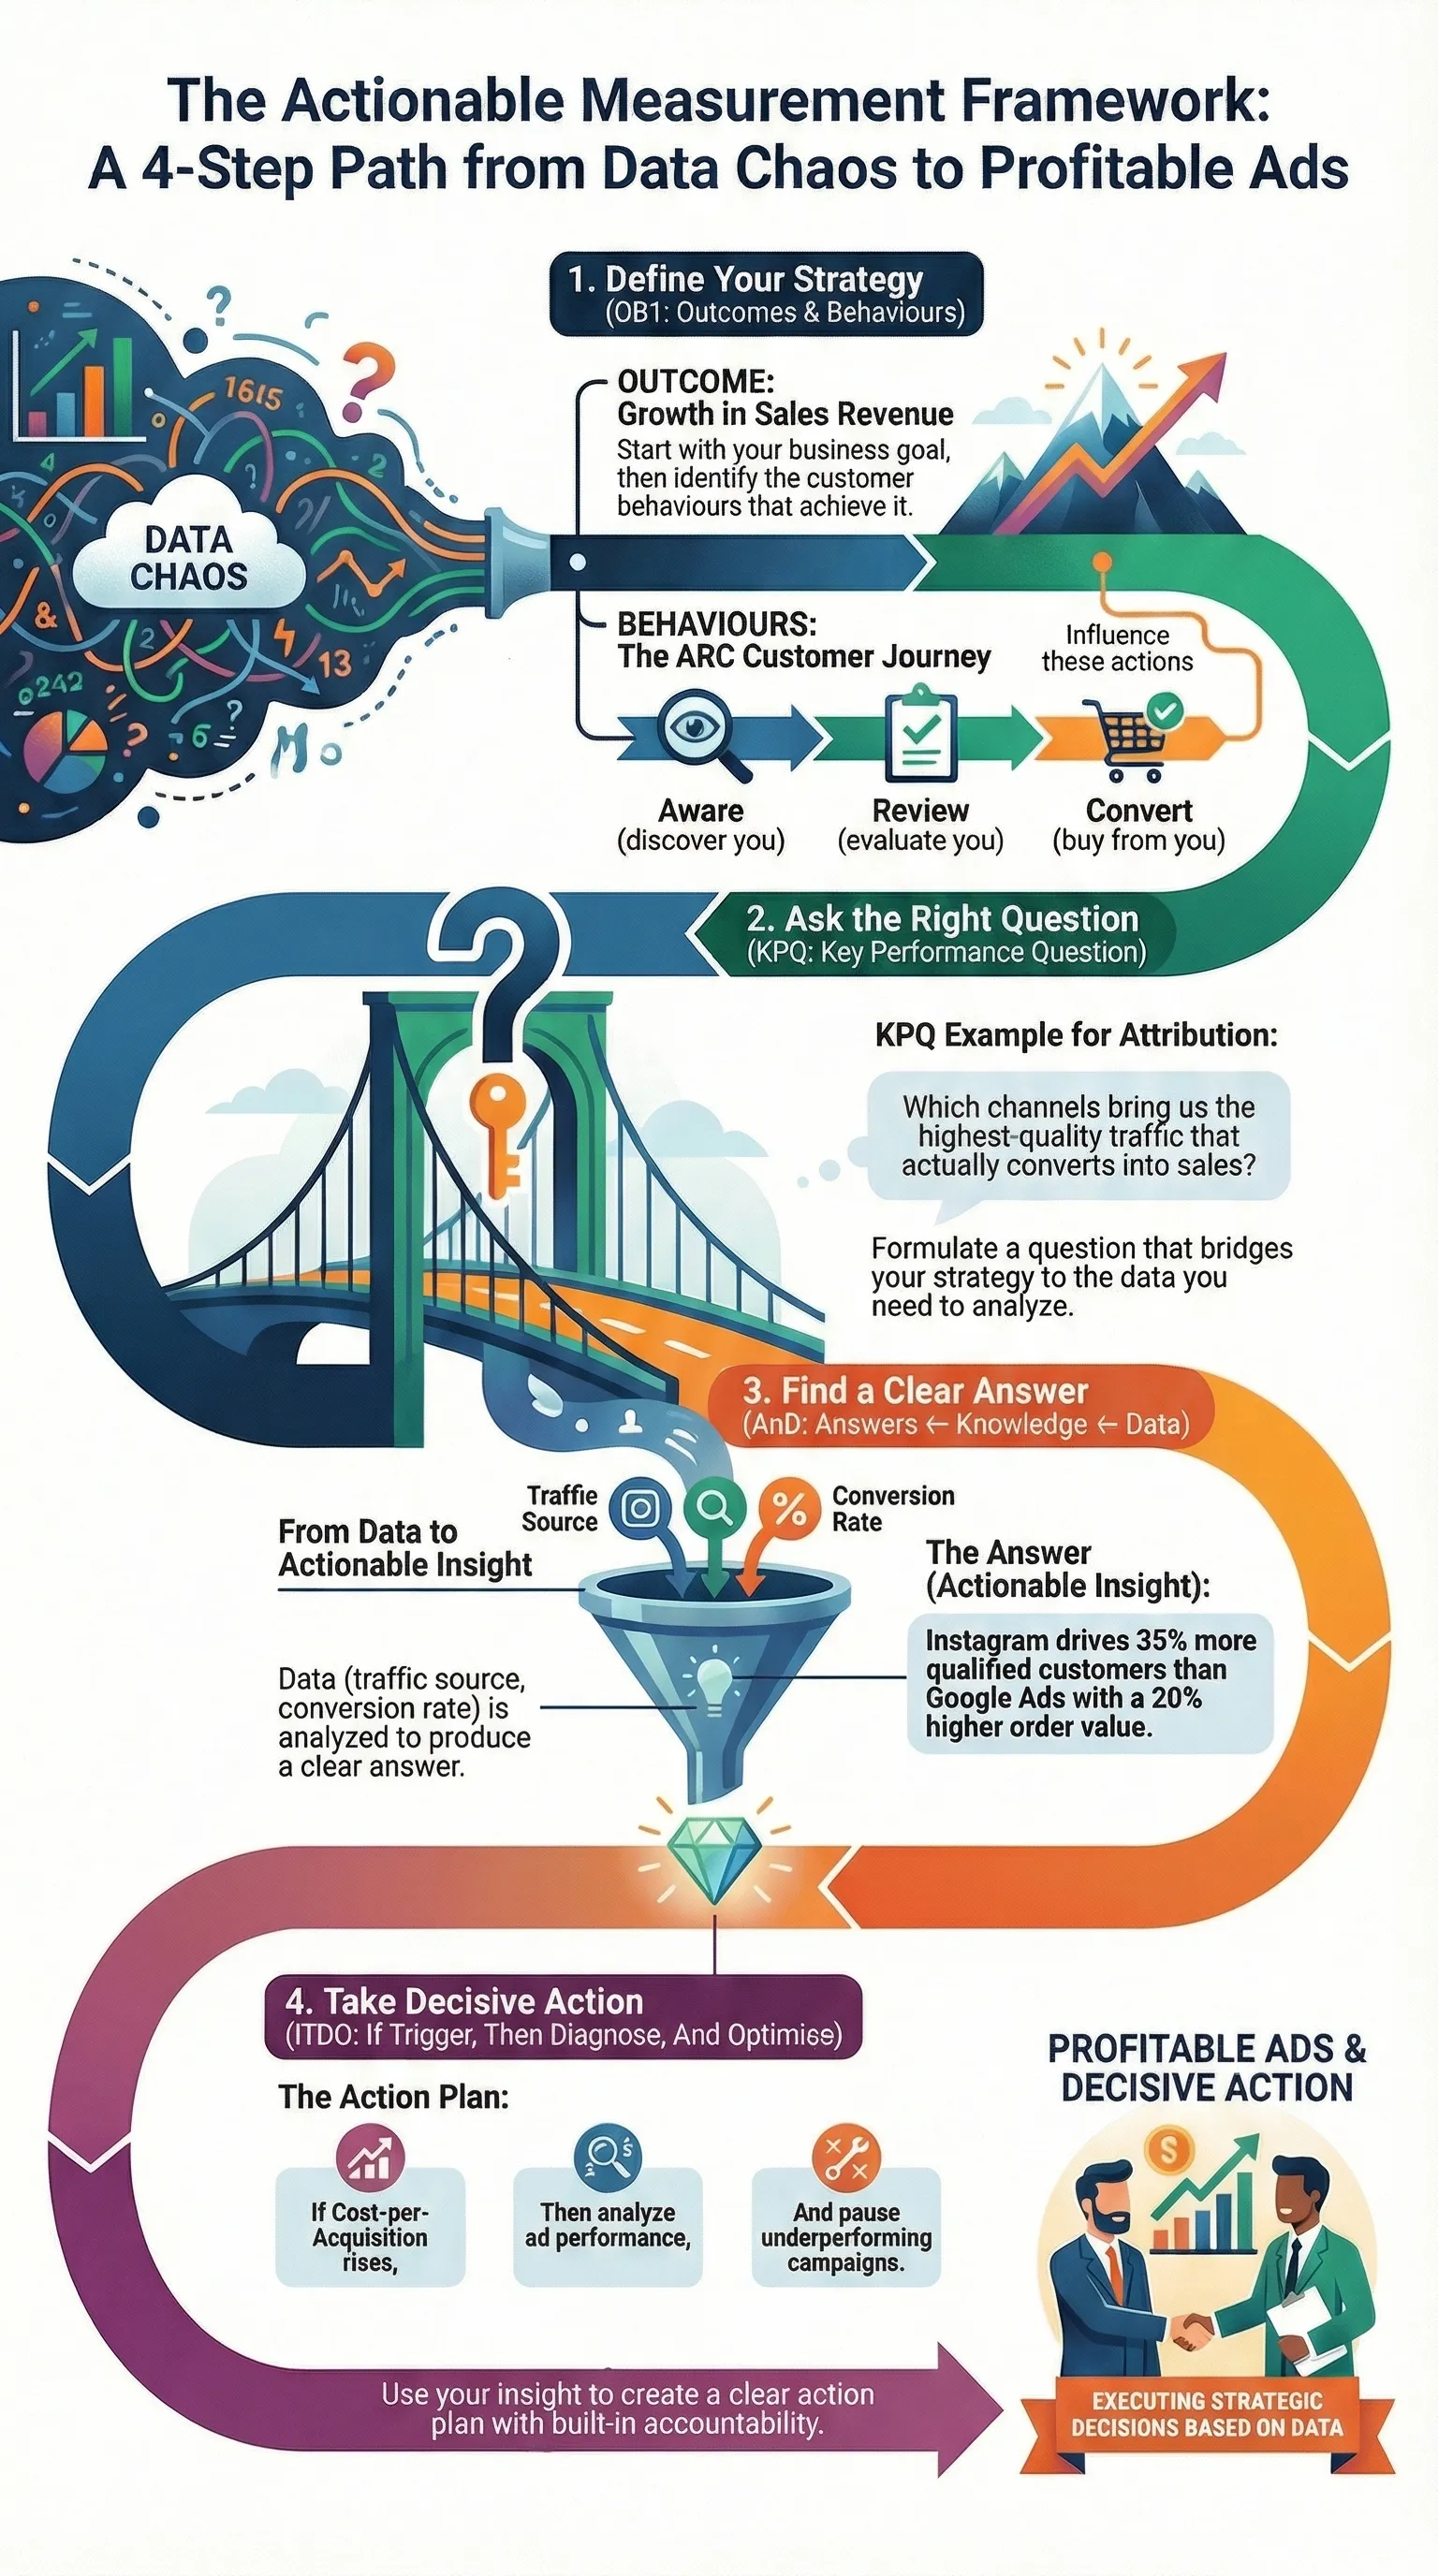
Are you trying to be data-driven in your business but you are lost in a sea of numbers and unable to get actionable insights? You have Analytics dashboards filled with colourful charts, but when it comes to “what should I do next?” you are left guessing. The Actionable Measurement Framework solves this problem by creating a clear bridge between your business strategy and the specific actions that drive results.
The framework helps you move from numbers for the sake of numbers, to concrete, data-driven decisions, by linking the Outcomes you are trying to achieve to what to measure and what actions to take.
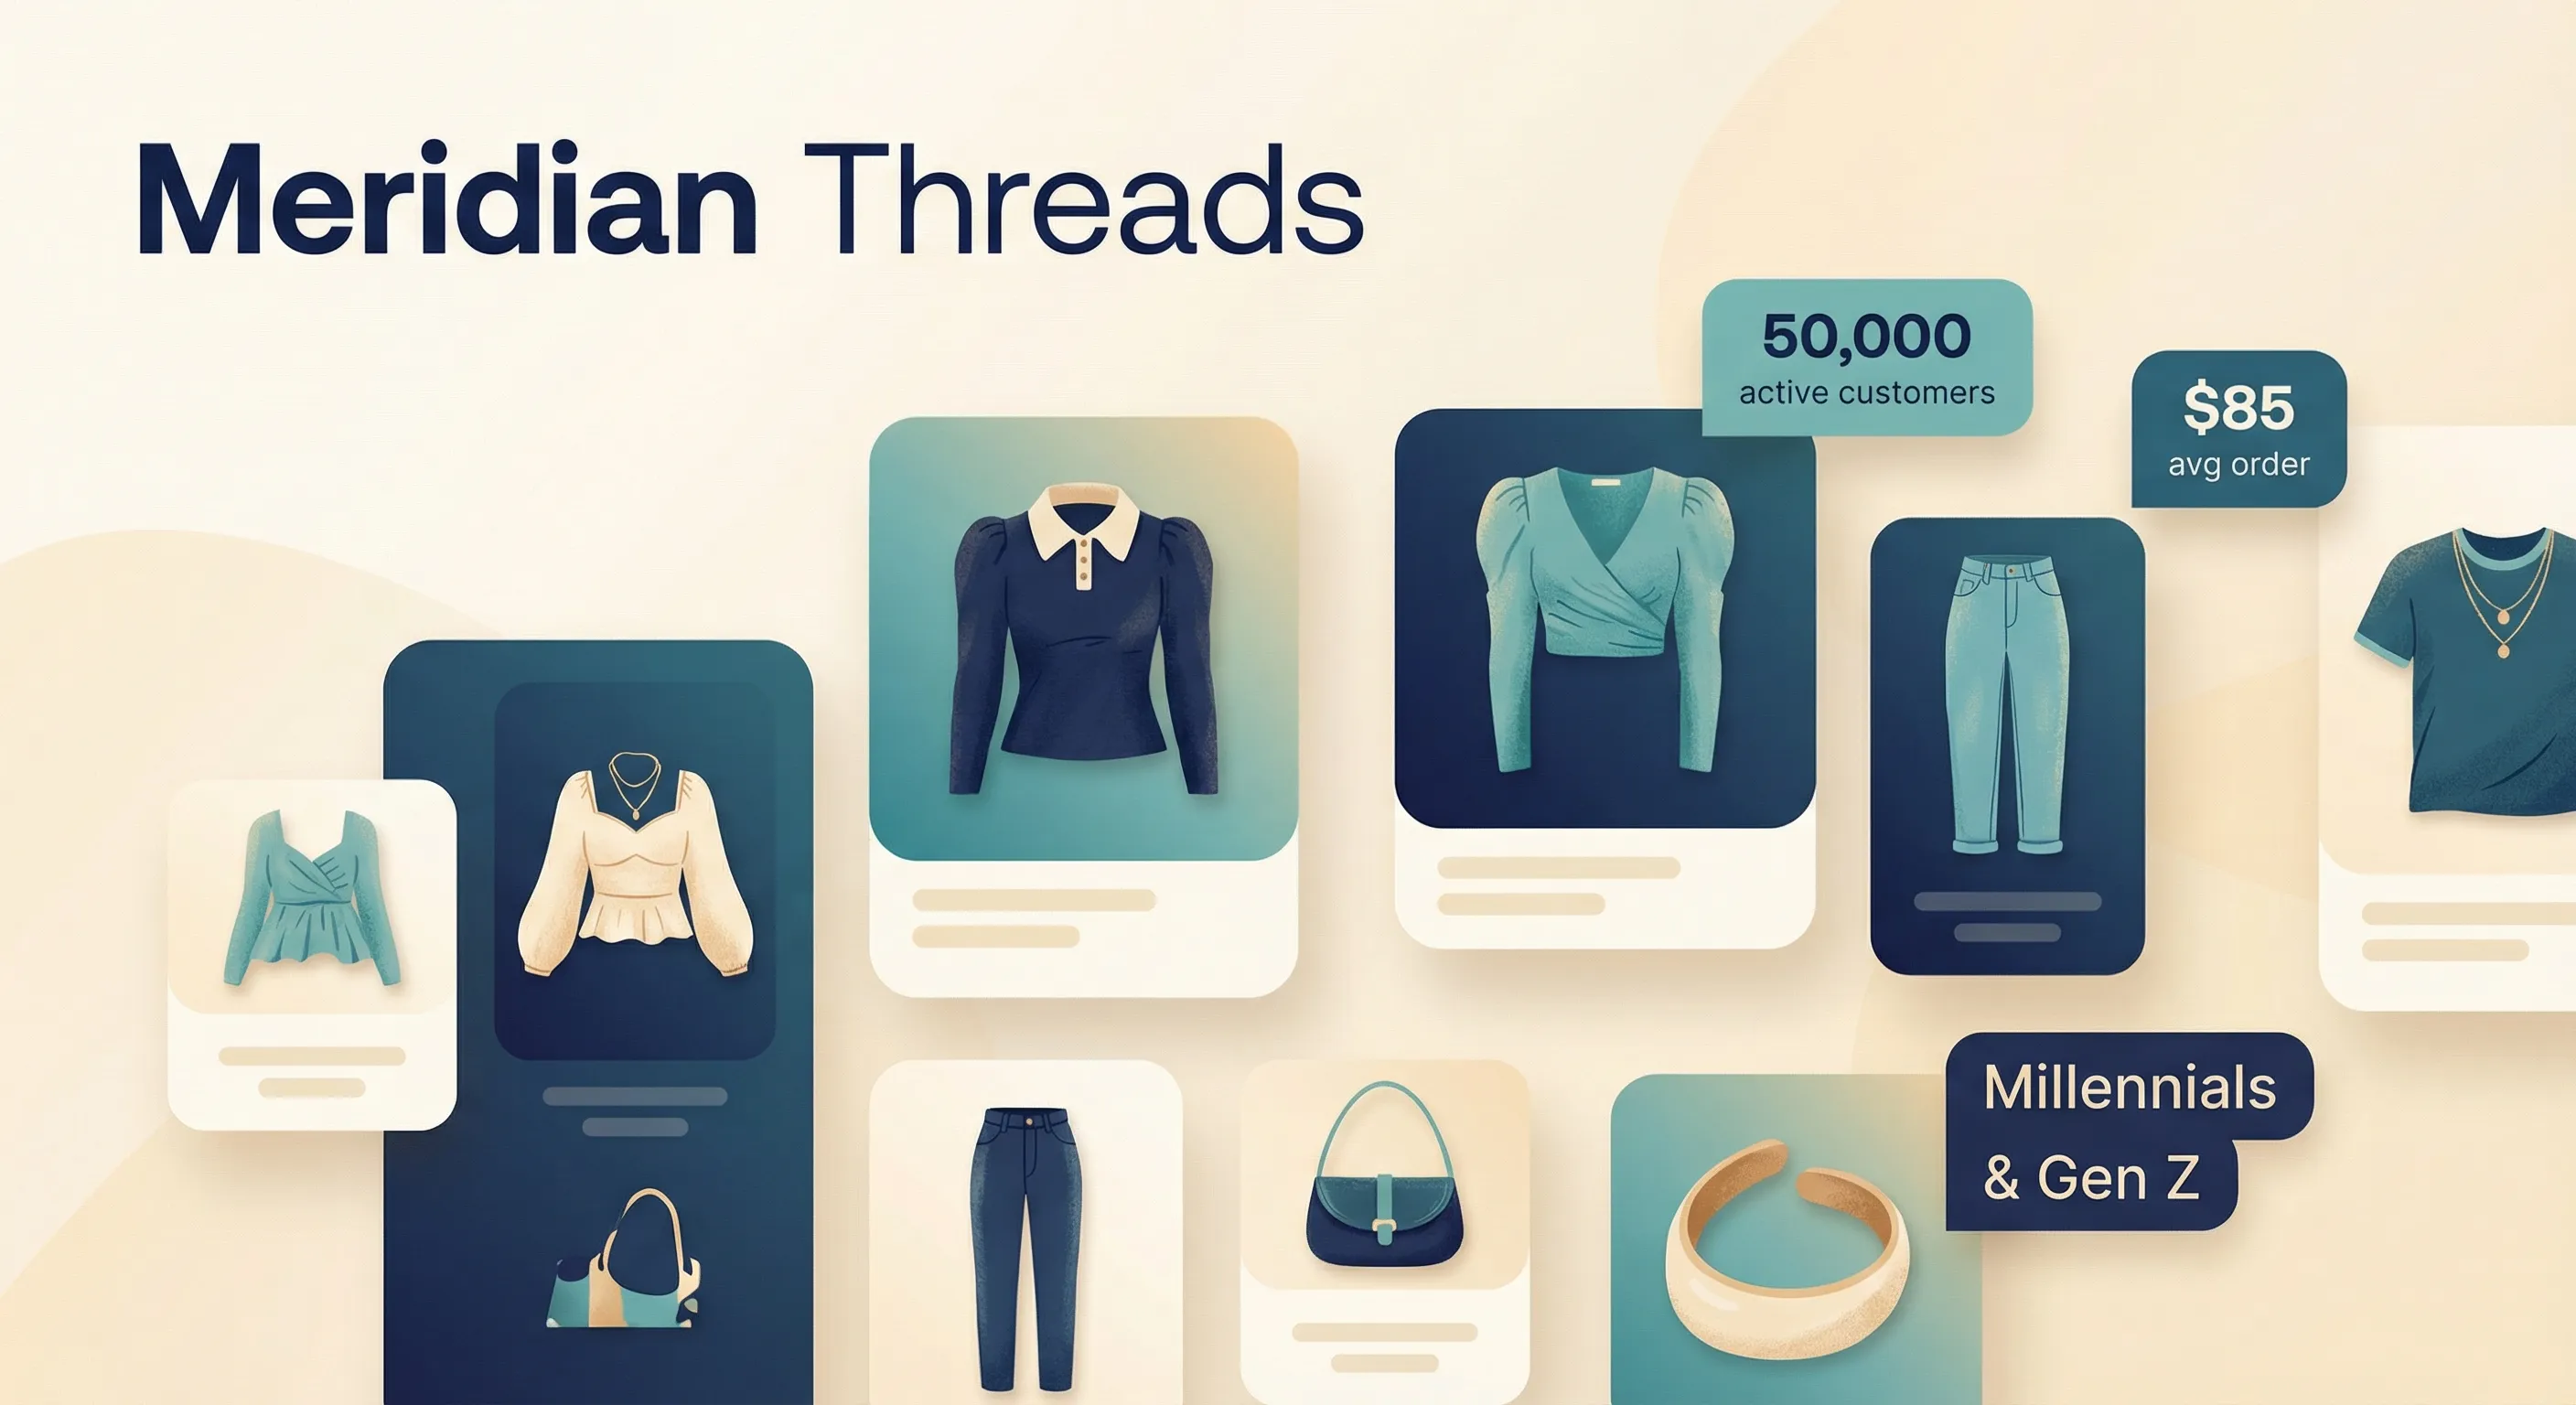
Meet “Meridian Threads” – Our Ecommerce Example
Throughout this framework, we’ll follow Meridian Threads, a mid-sized online clothing retailer, to see how these concepts work in practice. Meridian Threads sells trendy apparel to millennials and Gen Z customers, with average order values around $85 and a growing customer base of 50,000 active buyers.
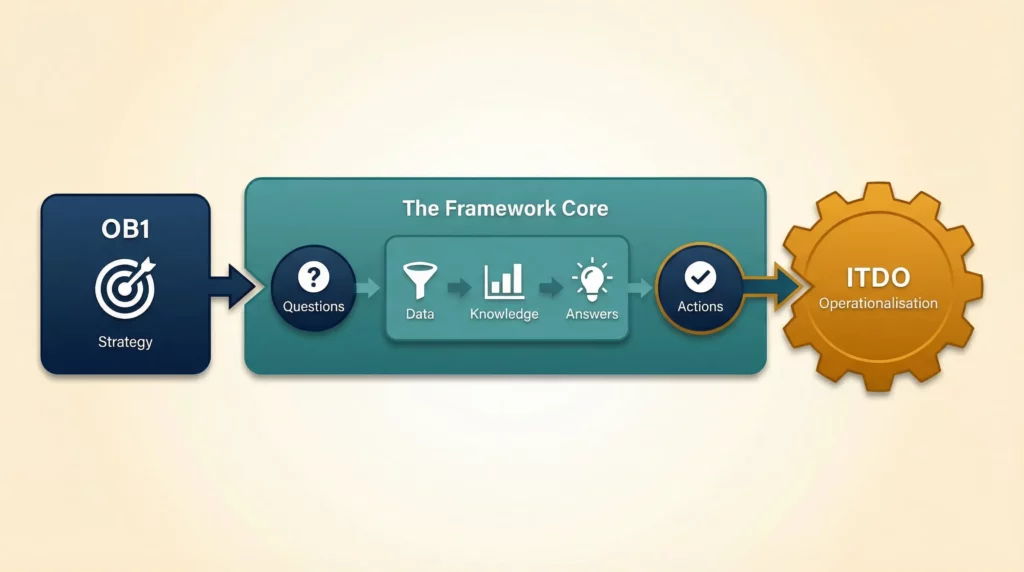
Throughout this guide, we’ll follow Meridian Threads to see how these concepts work in practice. But first, here’s the complete Actionable Measurement Framework at a glance:
Now let’s break down each component, starting with the foundation…
Table of Contents
OB1: Outcomes and Behaviours 1st (Step 1)
Start with Strategy… Not Tools
One of the biggest mistakes you can make is diving straight into analytics tools without knowing what you are looking for. While it may seem like the easiest thing to do, it can turn out to be like trying to navigate without knowing the final destination, nor the landmarks to look out for to know if you are on track. What you need on your journey is a guide, and that guide is OB1 – Outcomes and Behaviours 1st.
OB1 is your only hope!
OB1 is the most important mindset shift. It is based on the principle that for a successful measurement strategy, you must start with clarity on why you are measuring before you decide what to measure.
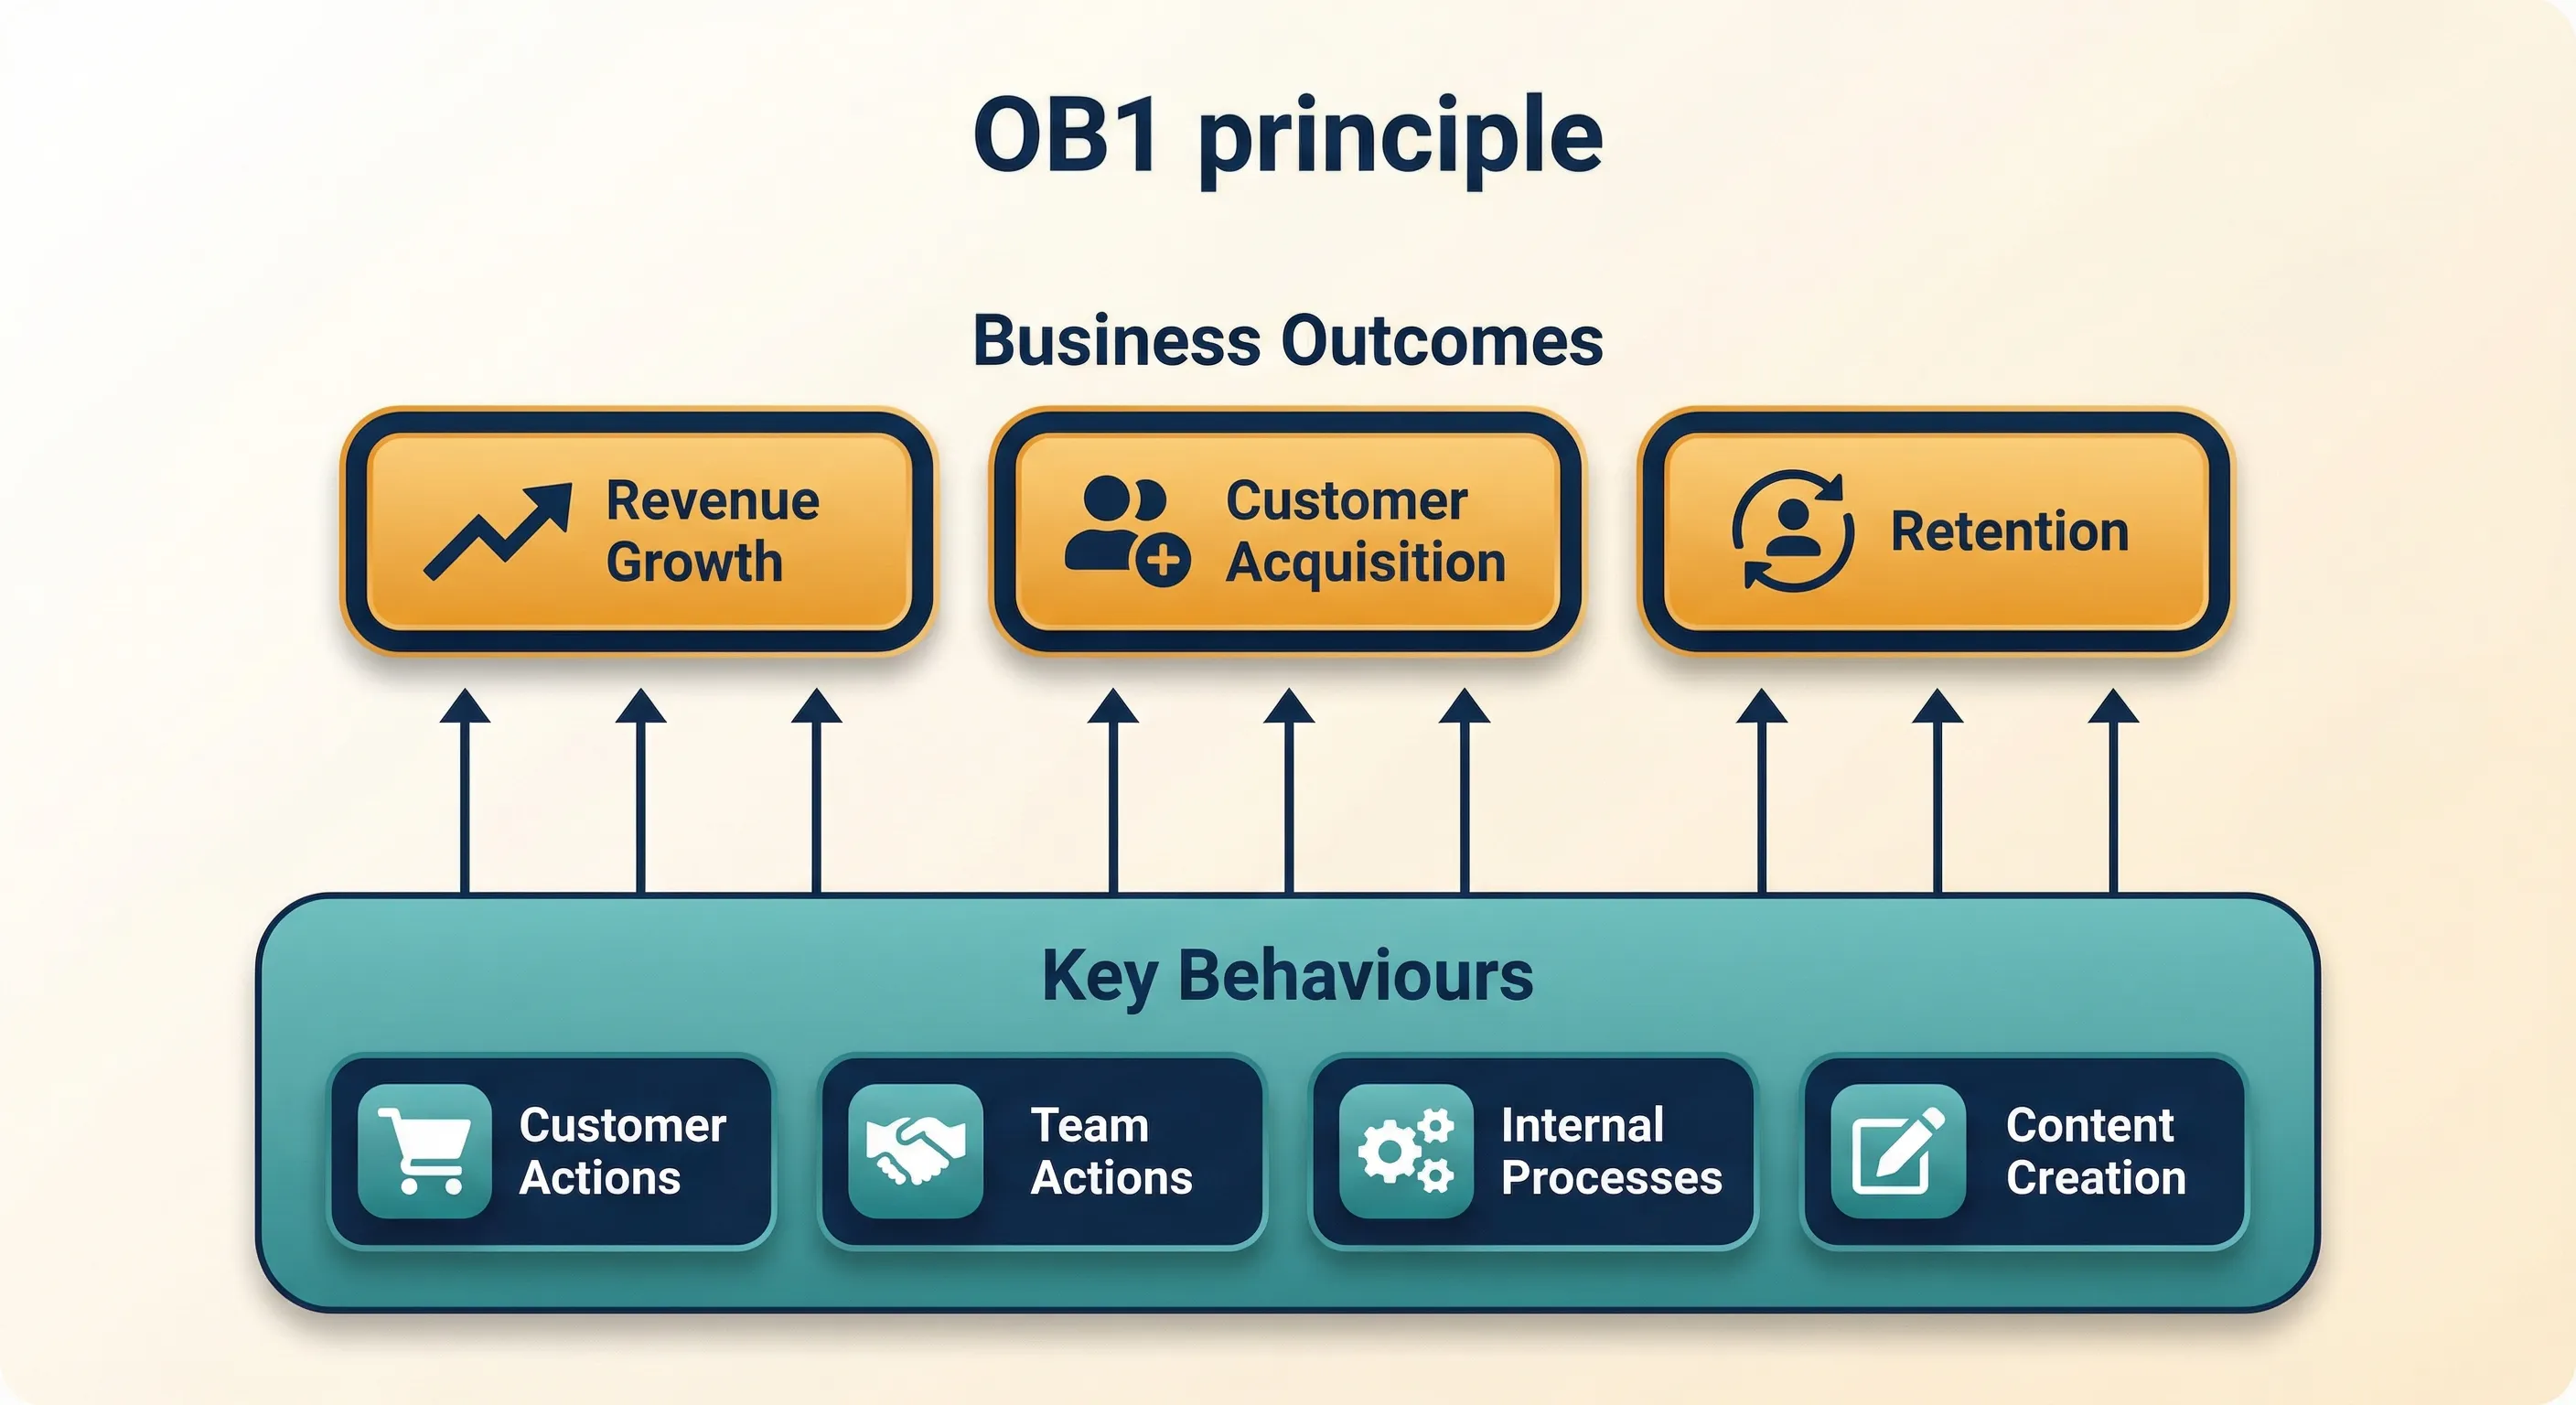
The “Why”: Business Outcomes
Every business has specific Outcomes they are trying to achieve. These might include:
Revenue and Growth (Meridian Threads):
- Growing sales revenue from $2M to $3M annually
- Increasing qualified leads (email subscribers) by 40%
- Expanding market share in sustainable fashion
Operational Excellence:
- Reducing operational costs
- Improving process efficiency
- Increasing productivity
People and Culture:
- Improving employee retention
- Building team expertise
- Enhancing customer satisfaction
Strategic Positioning:
- Building brand awareness
- Establishing thought leadership
- Creating competitive advantages
Sustainability and Impact:
- Reducing environmental footprint
- Supporting community initiatives
- Achieving regulatory compliance
Getting crystal clear on these outcomes is your first step because it helps narrow your focus from measuring everything to measuring what matters.
The “How”: Behaviours
Business outcomes don’t happen in a vacuum – they occur when specific behaviours take place to create them. These critical behaviours bridge the gap between what you want (Outcomes) and what needs to happen to create what you want. Depending on your business, the behaviours that drive your outcomes might include:
- Customer behaviours: How people discover, evaluate, and purchase your products or services
- Team behaviours: How employees collaborate, complete tasks, or deliver services
- Partner behaviours: How distributors, affiliates, or suppliers contribute to your success
- Content behaviours: How content gets created, published, and distributed
- Process behaviours: How workflows, systems, and operations function
- Communication behaviours: How information flows within and outside your organization
Understanding this connection is crucial because you can’t directly control Outcomes, but you can influence the behaviours that lead to them. In other words, measuring Outcomes gives you lagging indicators – metrics that tell you what already happened. Measuring the behaviours that lead to Outcomes gives you leading indicators – metrics that signal what is likely to happen next. To be proactive, you need to measure behaviours that take place before the final Outcome.
Got an Offer? Start with the Story ARC
For web businesses like Meridian Threads, user behaviours typically follow a narrative arc to complete offers, such as making a purchase. Understanding this journey helps you structure your measurement strategy and identify the most important touchpoints. We’ll use these ARC behaviours as a consistent theme throughout the remaining sections.
- Aware
- Review
- Convert
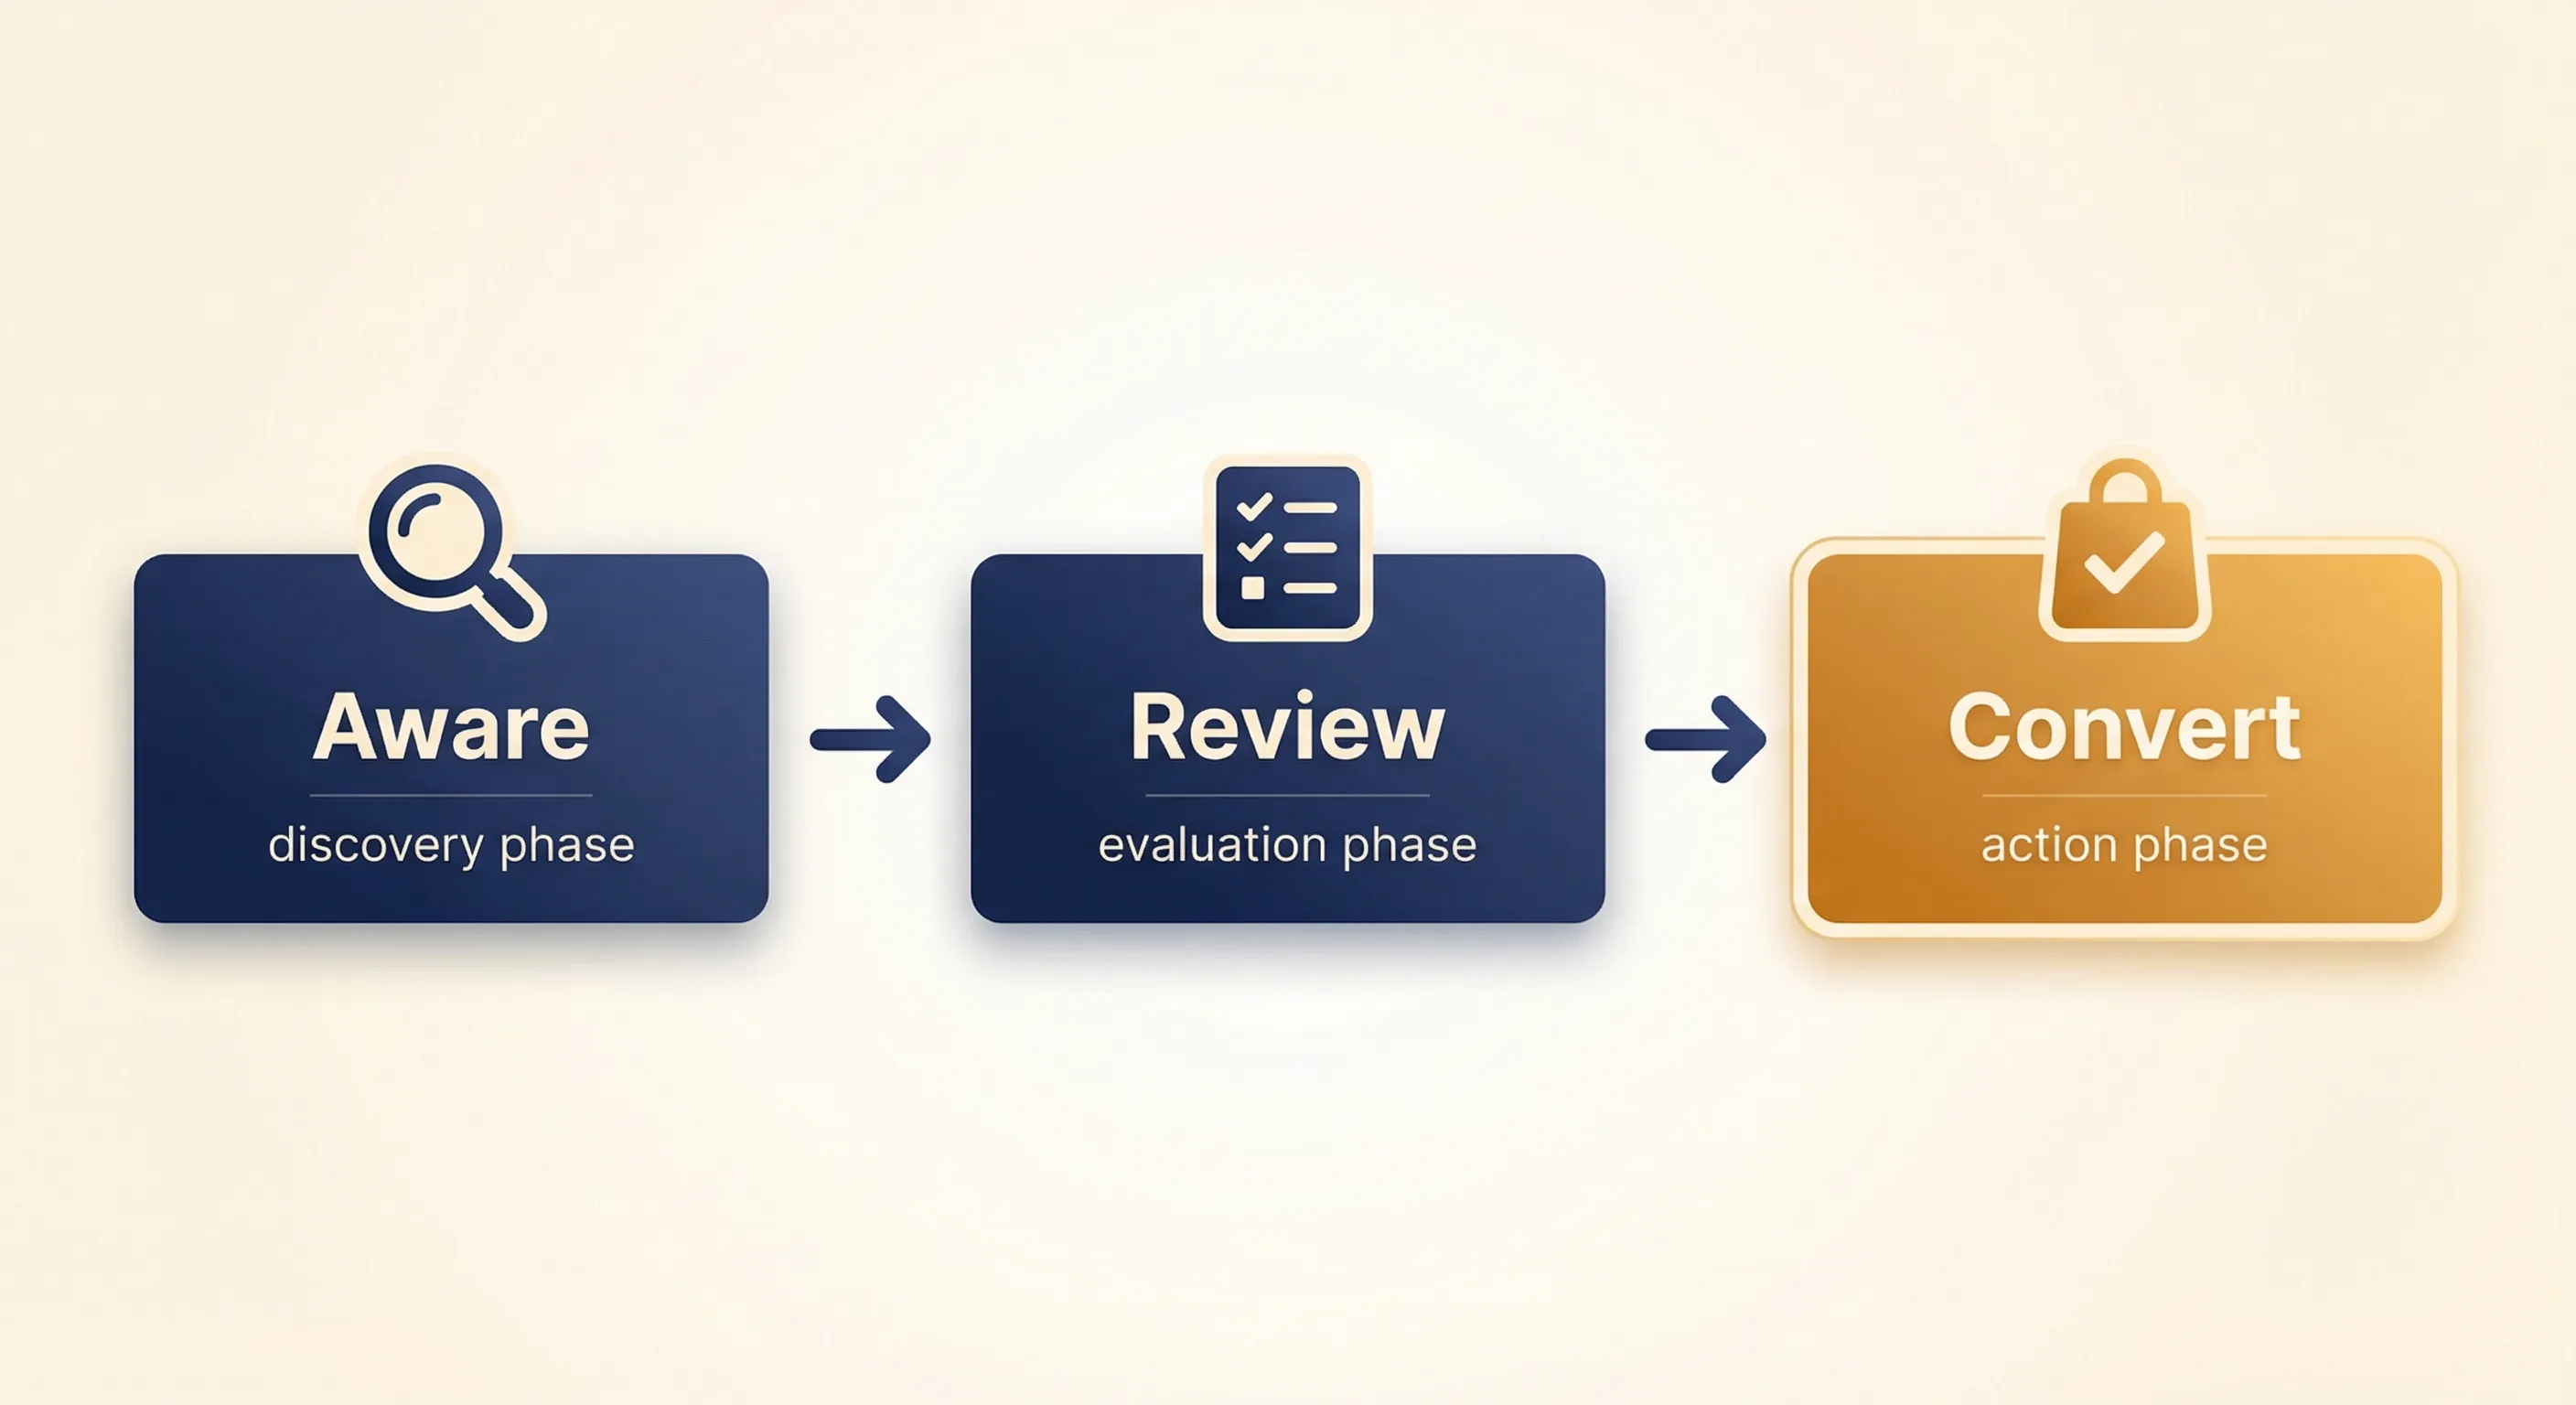
Aware: How Users Discover Your Offers
This is the top of your funnel – how users become aware of your offer or the problem it solves. Discovery behaviours include finding your site through search engines, clicking on social media posts, following referral links from other websites, or typing your URL directly after hearing about your offer offline.
- Google searches for “sustainable fashion” or “trendy millennial clothing”
- Instagram posts featuring their latest collections
- Referrals from fashion bloggers and influencers
- Direct visits from customers who heard about them offline
Review: How Users Evaluate Your Offer
Once users are aware of your offer, they need to evaluate whether it meets their needs. Review behaviours include browsing multiple pages, reading product descriptions, watching demo videos, downloading resources, comparing features, checking reviews and testimonials, or engaging with interactive tools.
- Browsing multiple product categories and collections
- Reading detailed product descriptions and sizing guides
- Checking customer reviews and photos
- Comparing prices with competitors
- Watching styling videos and lookbooks
Convert: The Final Step to Outcomes
This is where users take the actions that directly drive your business outcomes. Conversion behaviours include making purchases, signing up for accounts, submitting contact forms, subscribing to newsletters, booking consultations, or completing any other goal actions that represent success for your offer.
- Adding items to cart and completing checkout
- Signing up for the email newsletter for exclusive offers
- Creating accounts for faster future purchases
- Referring friends through the loyalty program
What to do After the Story ARC is OVER?
The customer journey doesn’t end at conversion – that’s just the beginning of the relationship. While ARC covers the path to initial conversion, OVER addresses the critical post-conversion behaviours that drive long-term business value.
- Onboard
- Value
- Expand
- Return
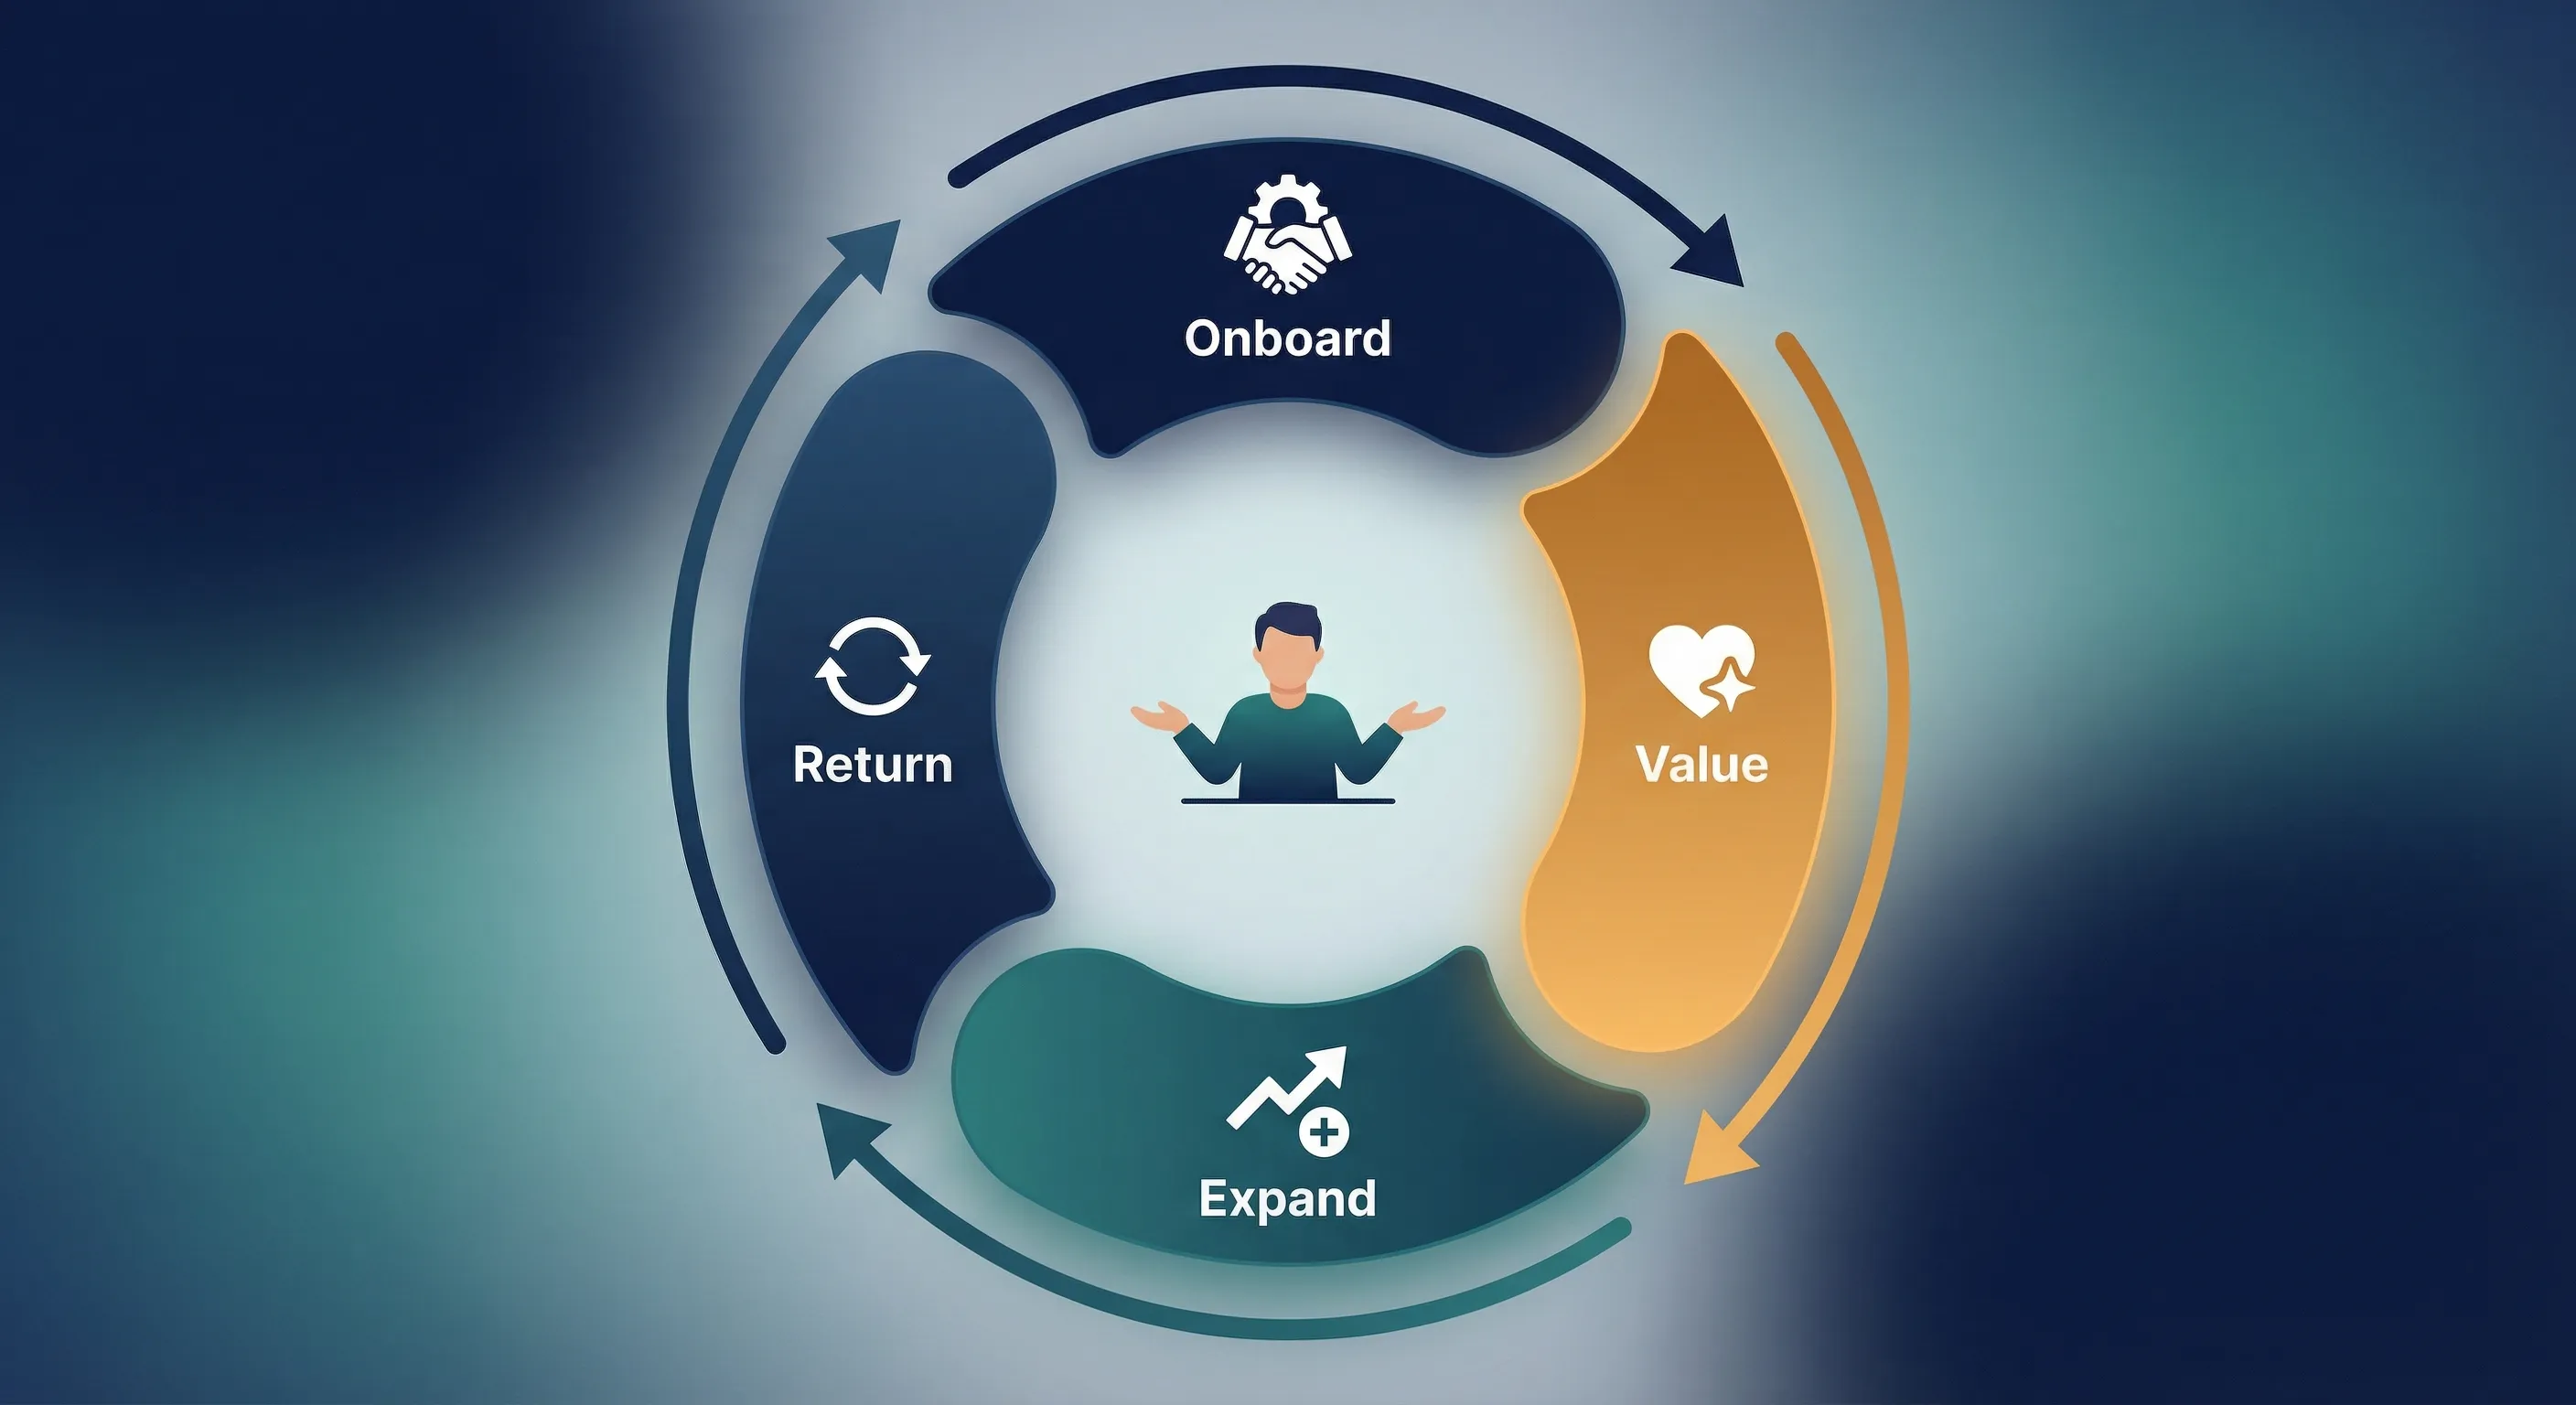
Onboard: Getting Customers Successfully Started
The “First Success” Stage
This is the critical period after conversion where customers learn how to use your product or service effectively. Success here determines whether they’ll become long-term customers or early churners.
- Setting up their customer account and preferences
- Receiving and trying on their first order
- Learning about sizing, care instructions, and return policies
- Engaging with welcome email sequences and style guides
- Connecting with customer service for initial questions
Value: Customers Experience the Promised Benefit
The “Promise Delivered” Stage
This is where customers actually receive and experience the value they expected when they made their purchase. It’s the fulfillment of your conversion promise.
- Wearing and enjoying their purchased clothing
- Receiving compliments and satisfaction from their style choices
- Successfully caring for items according to instructions
- Sharing photos on social media wearing Meridian Threads pieces
- Leaving positive reviews about product quality and fit
Expand: Increasing Purchase Frequency and Variety
The “Relationship Deepening” Stage
This focuses on customers making additional purchases within the same relationship cycle – buying more products, upgrading to premium options, or purchasing complementary items before they would naturally need to repurchase.
- Adding coordinating pieces to complete outfits
- Purchasing from new product categories (accessories, shoes, bags)
- Upgrading to premium or limited-edition items
- Buying seasonal collections or trend pieces
- Taking advantage of bundle offers or styling services
Return: Coming Back for Repeat Business
The “Loyalty and Lifecycle” Stage
This addresses customers who come back for repurchase cycles – replacing worn items, buying for new seasons, or returning after a natural break in the relationship. This is about long-term customer retention and lifetime value.
- Repurchasing basics like t-shirts, jeans, or undergarments when worn out
- Shopping new seasonal collections (spring/summer, fall/winter)
- Returning after life changes (weight change, job change, style evolution)
- Reactivating dormant accounts after months of inactivity
- Becoming brand advocates who refer friends and family
The Purpose of Analytics Tools… Is Not Numbers
It is quite easy to fall into the “numbers for the sake of numbers” trap when diving into analytics tools without having a plan beforehand. Analytics tools like Google Analytics 4 or Looker Studio are not just about presenting numbers. In reality, these tools exist to answer questions.
The key insight is that these questions should be derived from your desired Outcomes and the Behaviours required to achieve them – not from whatever metrics happen to be easy to track.
The Questions AnD Actions (QnA) Cycle
The Questions AnD Actions Cycle ensures that every piece of data you collect and analyse serves a purpose and leads to actionable insights. The “AnD” represents the crucial Answers ← Knowledge ← Data flow that transforms your questions into actionable insights, while the Action component is operationalised through the ITDO framework (explained in Step 4 below).
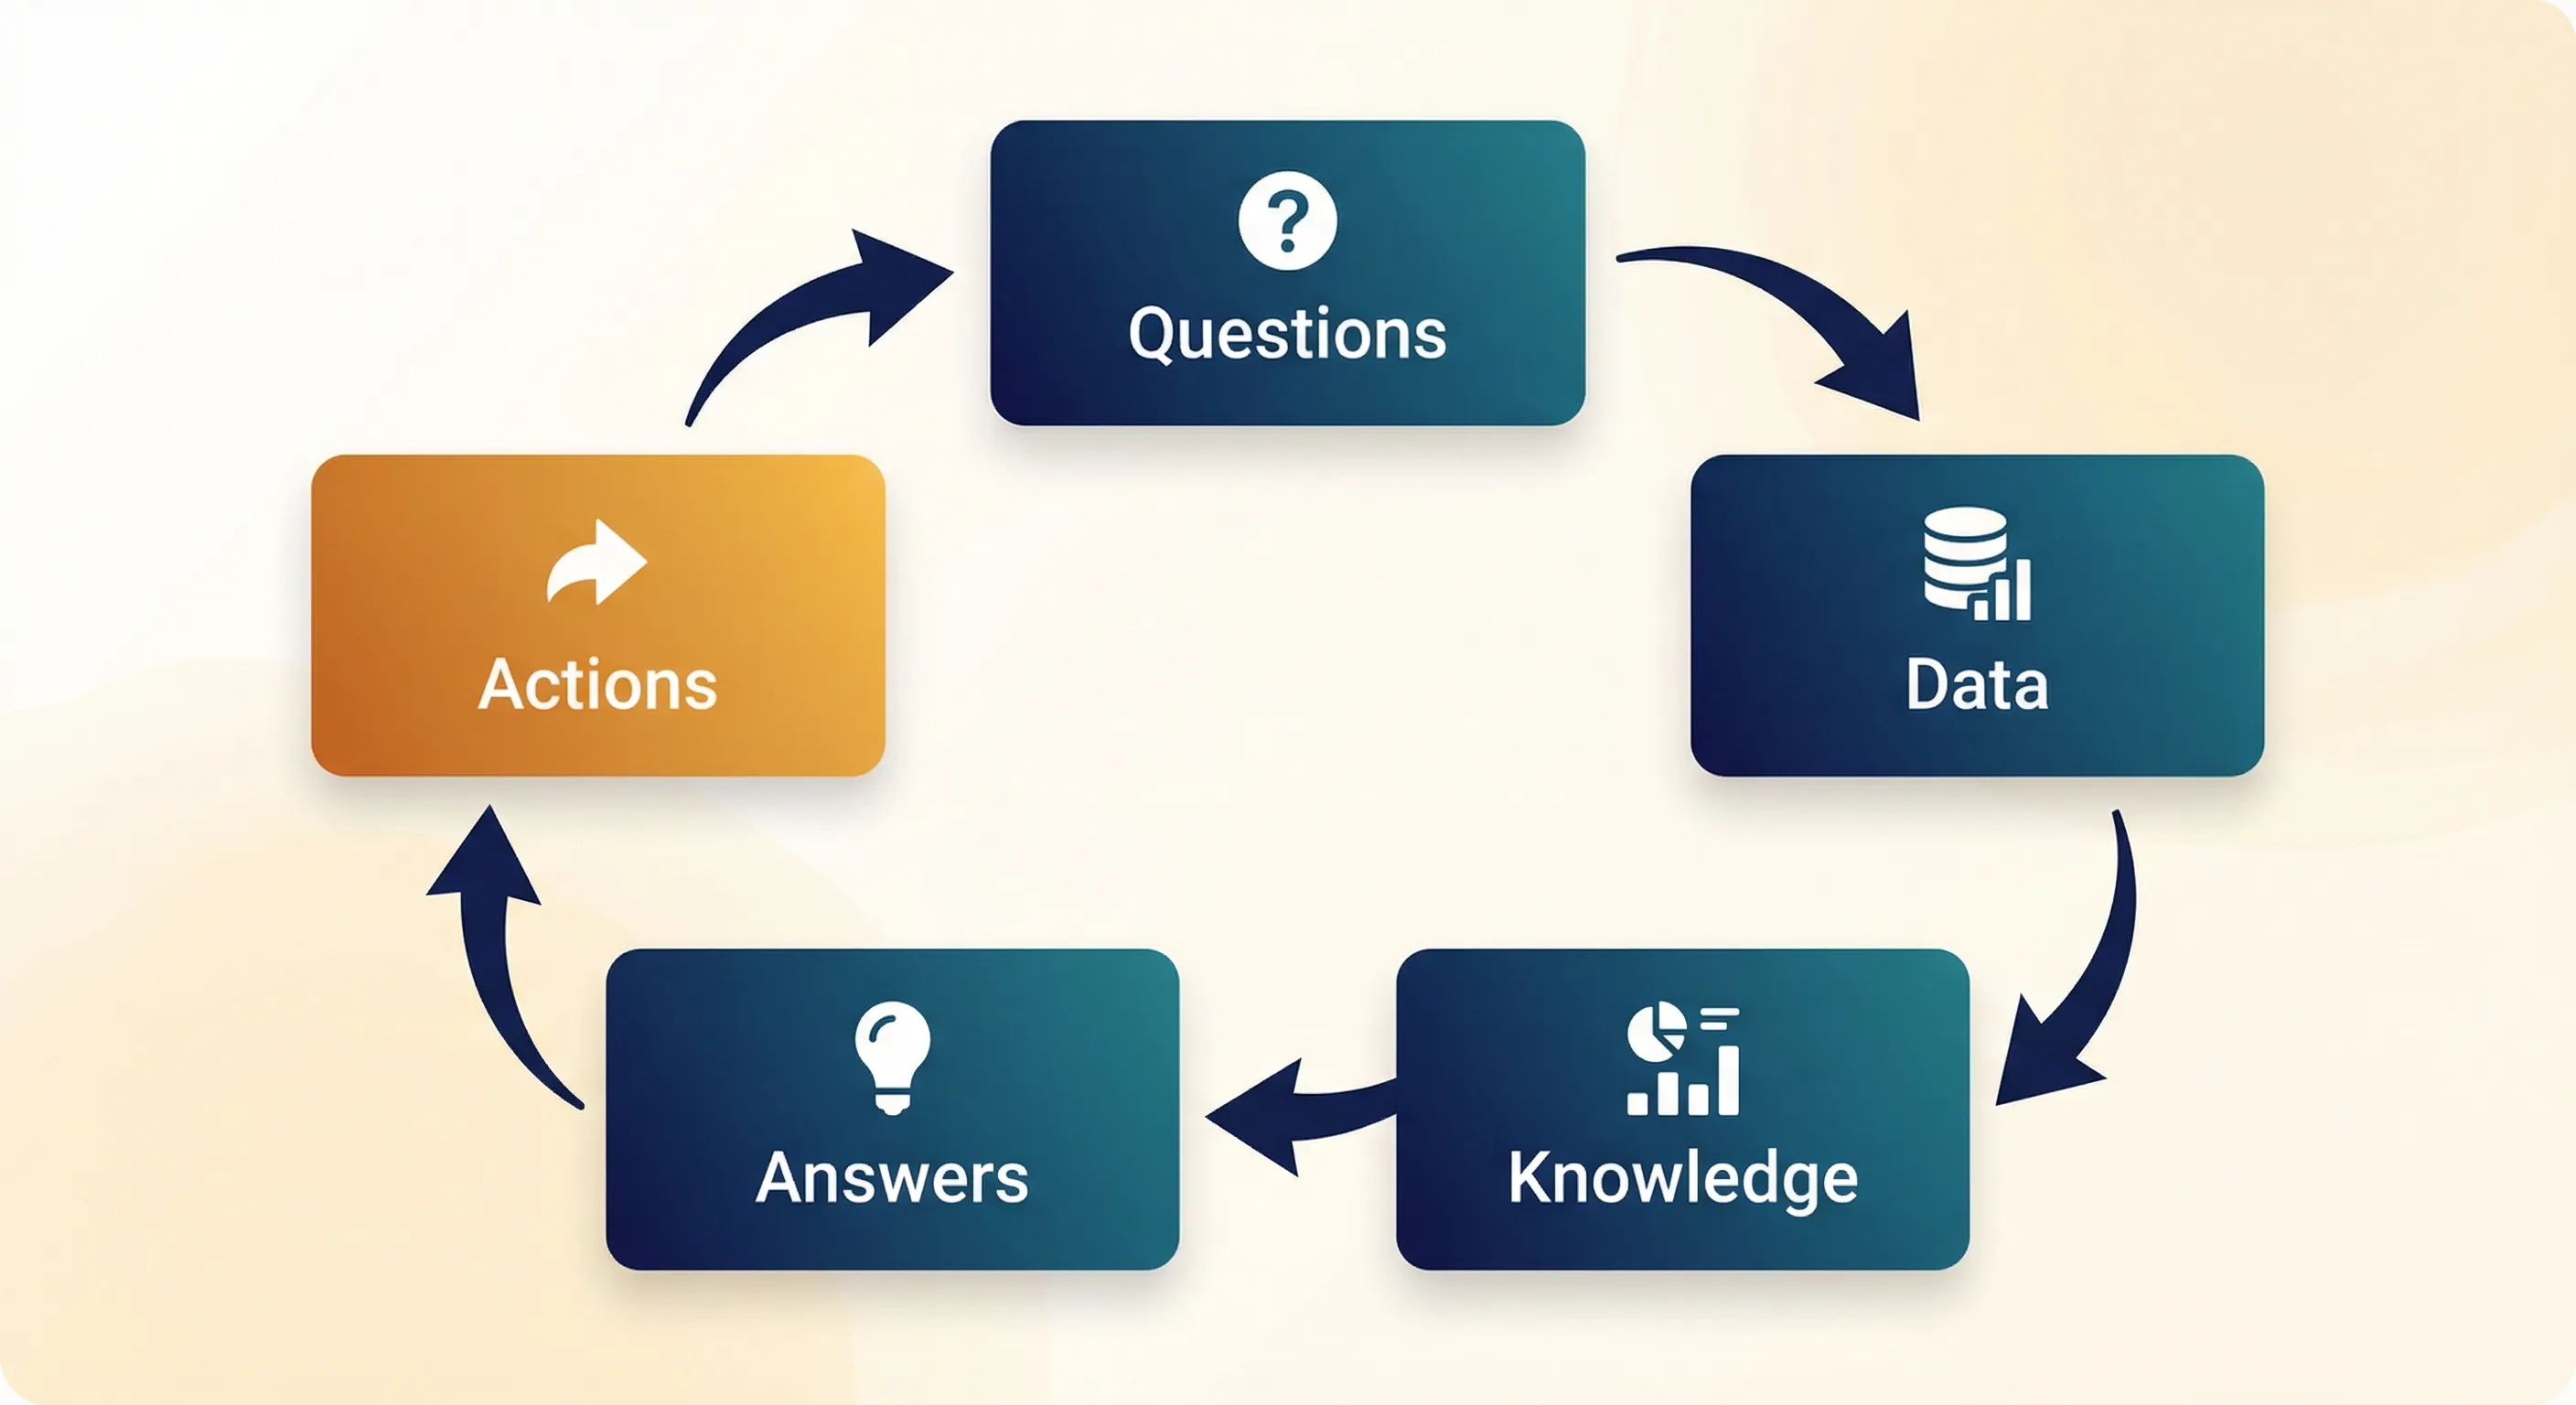
The Complete QnA Flow: Questions → AnD → Actions
Step 2: Questions – Key Performance Questions (KPQs)
Based on your desired Outcomes and the Behaviours that drive them, you formulate specific questions. These become your Key Performance Questions (KPQs) – the questions that, when answered, give you the knowledge needed to improve your results. Therefore, you only need to consider two types of questions:
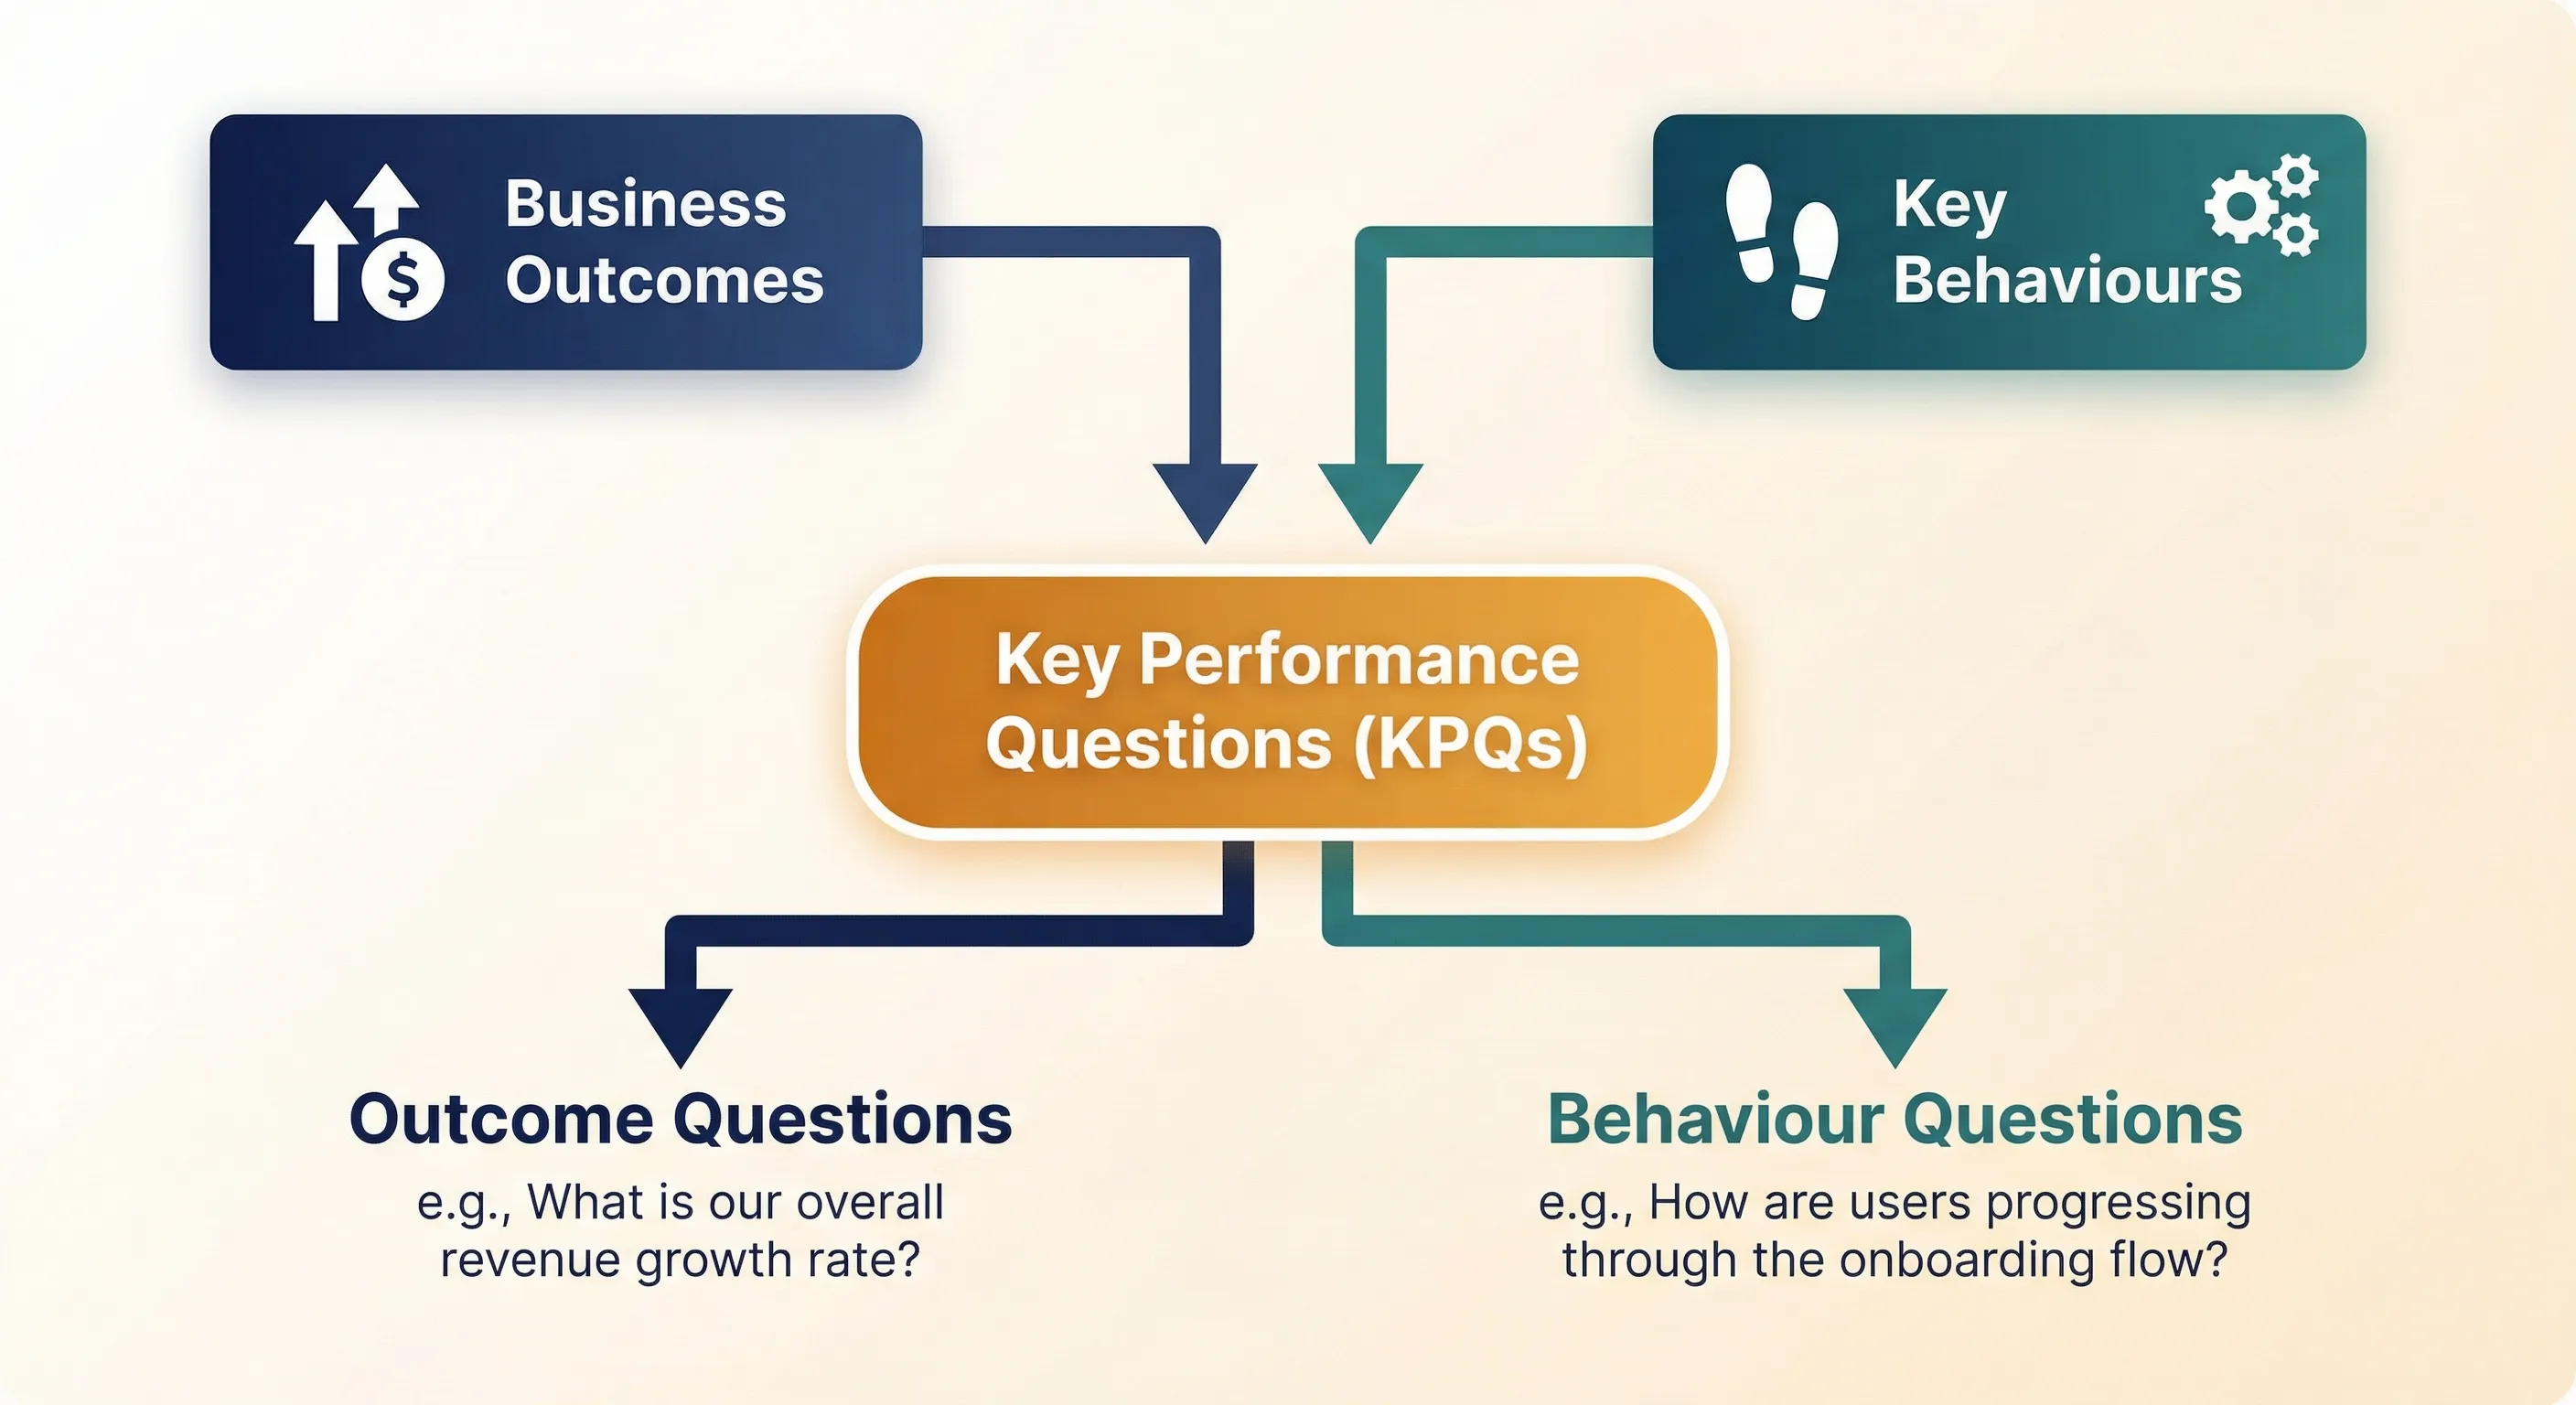
Outcome Questions focus on the end result:
- “What is our overall conversion rate for purchases?”
- “How much revenue are we generating per customer acquired?”
- “What is our average customer lifetime value?”
- “How effectively are we reducing operational costs?”
Behaviour Questions focus on the steps leading to Outcomes:
- “Where do people typically drop off in our process?”
- “Are our team members completing tasks efficiently?”
- “Which activities keep customers most engaged?”
- “How quickly are leads progressing through our pipeline?”
KPQs for Web Businesses Using ARC
For Meridian Threads, the KPQs map across the ARC framework to ensure comprehensive coverage:
Aware Stage Questions:
- “Are we attracting enough fashion-conscious millennials to our site?”
- “Which channels bring us the highest-quality traffic that converts?”
- “How does our brand awareness compare to sustainable fashion competitors?”
Review Stage Questions:
- “Are shoppers finding the product information they need to make purchase decisions?”
- “Which product pages and collections drive the most engagement?”
- “What causes potential customers to leave during the browsing phase?”
Convert Stage Questions:
- “Which traffic sources convert at the highest rate?”
- “What’s our conversion rate by device, age group, or geographic location?”
- “Which obstacles prevent more visitors from completing their purchase?”
By structuring your KPQs across the ARC framework, you ensure that you’re asking questions about every critical stage of the user journey, from initial discovery through final conversion.
KPQs for Web Business Using OVER
Onboard Stage:
- “Are new customers successfully using our product within their first week?”
- “What percentage of first-time buyers complete their account setup?”
- “How quickly do customers engage with our onboarding materials?”
Value Stage:
- “Are customers achieving the outcomes they expected from our products?”
- “How satisfied are customers with their purchase experience?”
- “What indicates customers are getting ongoing value from our offerings?”
Expand Stage:
- “How many product categories does the average customer purchase from?”
- “What percentage of customers make a second purchase within 90 days?”
- “Which customers are most likely to upgrade to premium offerings?”
Return Stage:
- “What’s our customer retention rate at 6, 12, and 24 months?”
- “How do we re-engage customers who haven’t purchased in 6+ months?”
- “What triggers customers to return after extended absence?”
Step 3: Answers ← Knowledge ← Data (AnD)
This is where Actionable Insights come from!
The beauty of Key Performance Questions is that they help you narrow down the data you need to consider. Not only that, but they are also a crucial input to figure out the proper representation of data so that insights become clear.
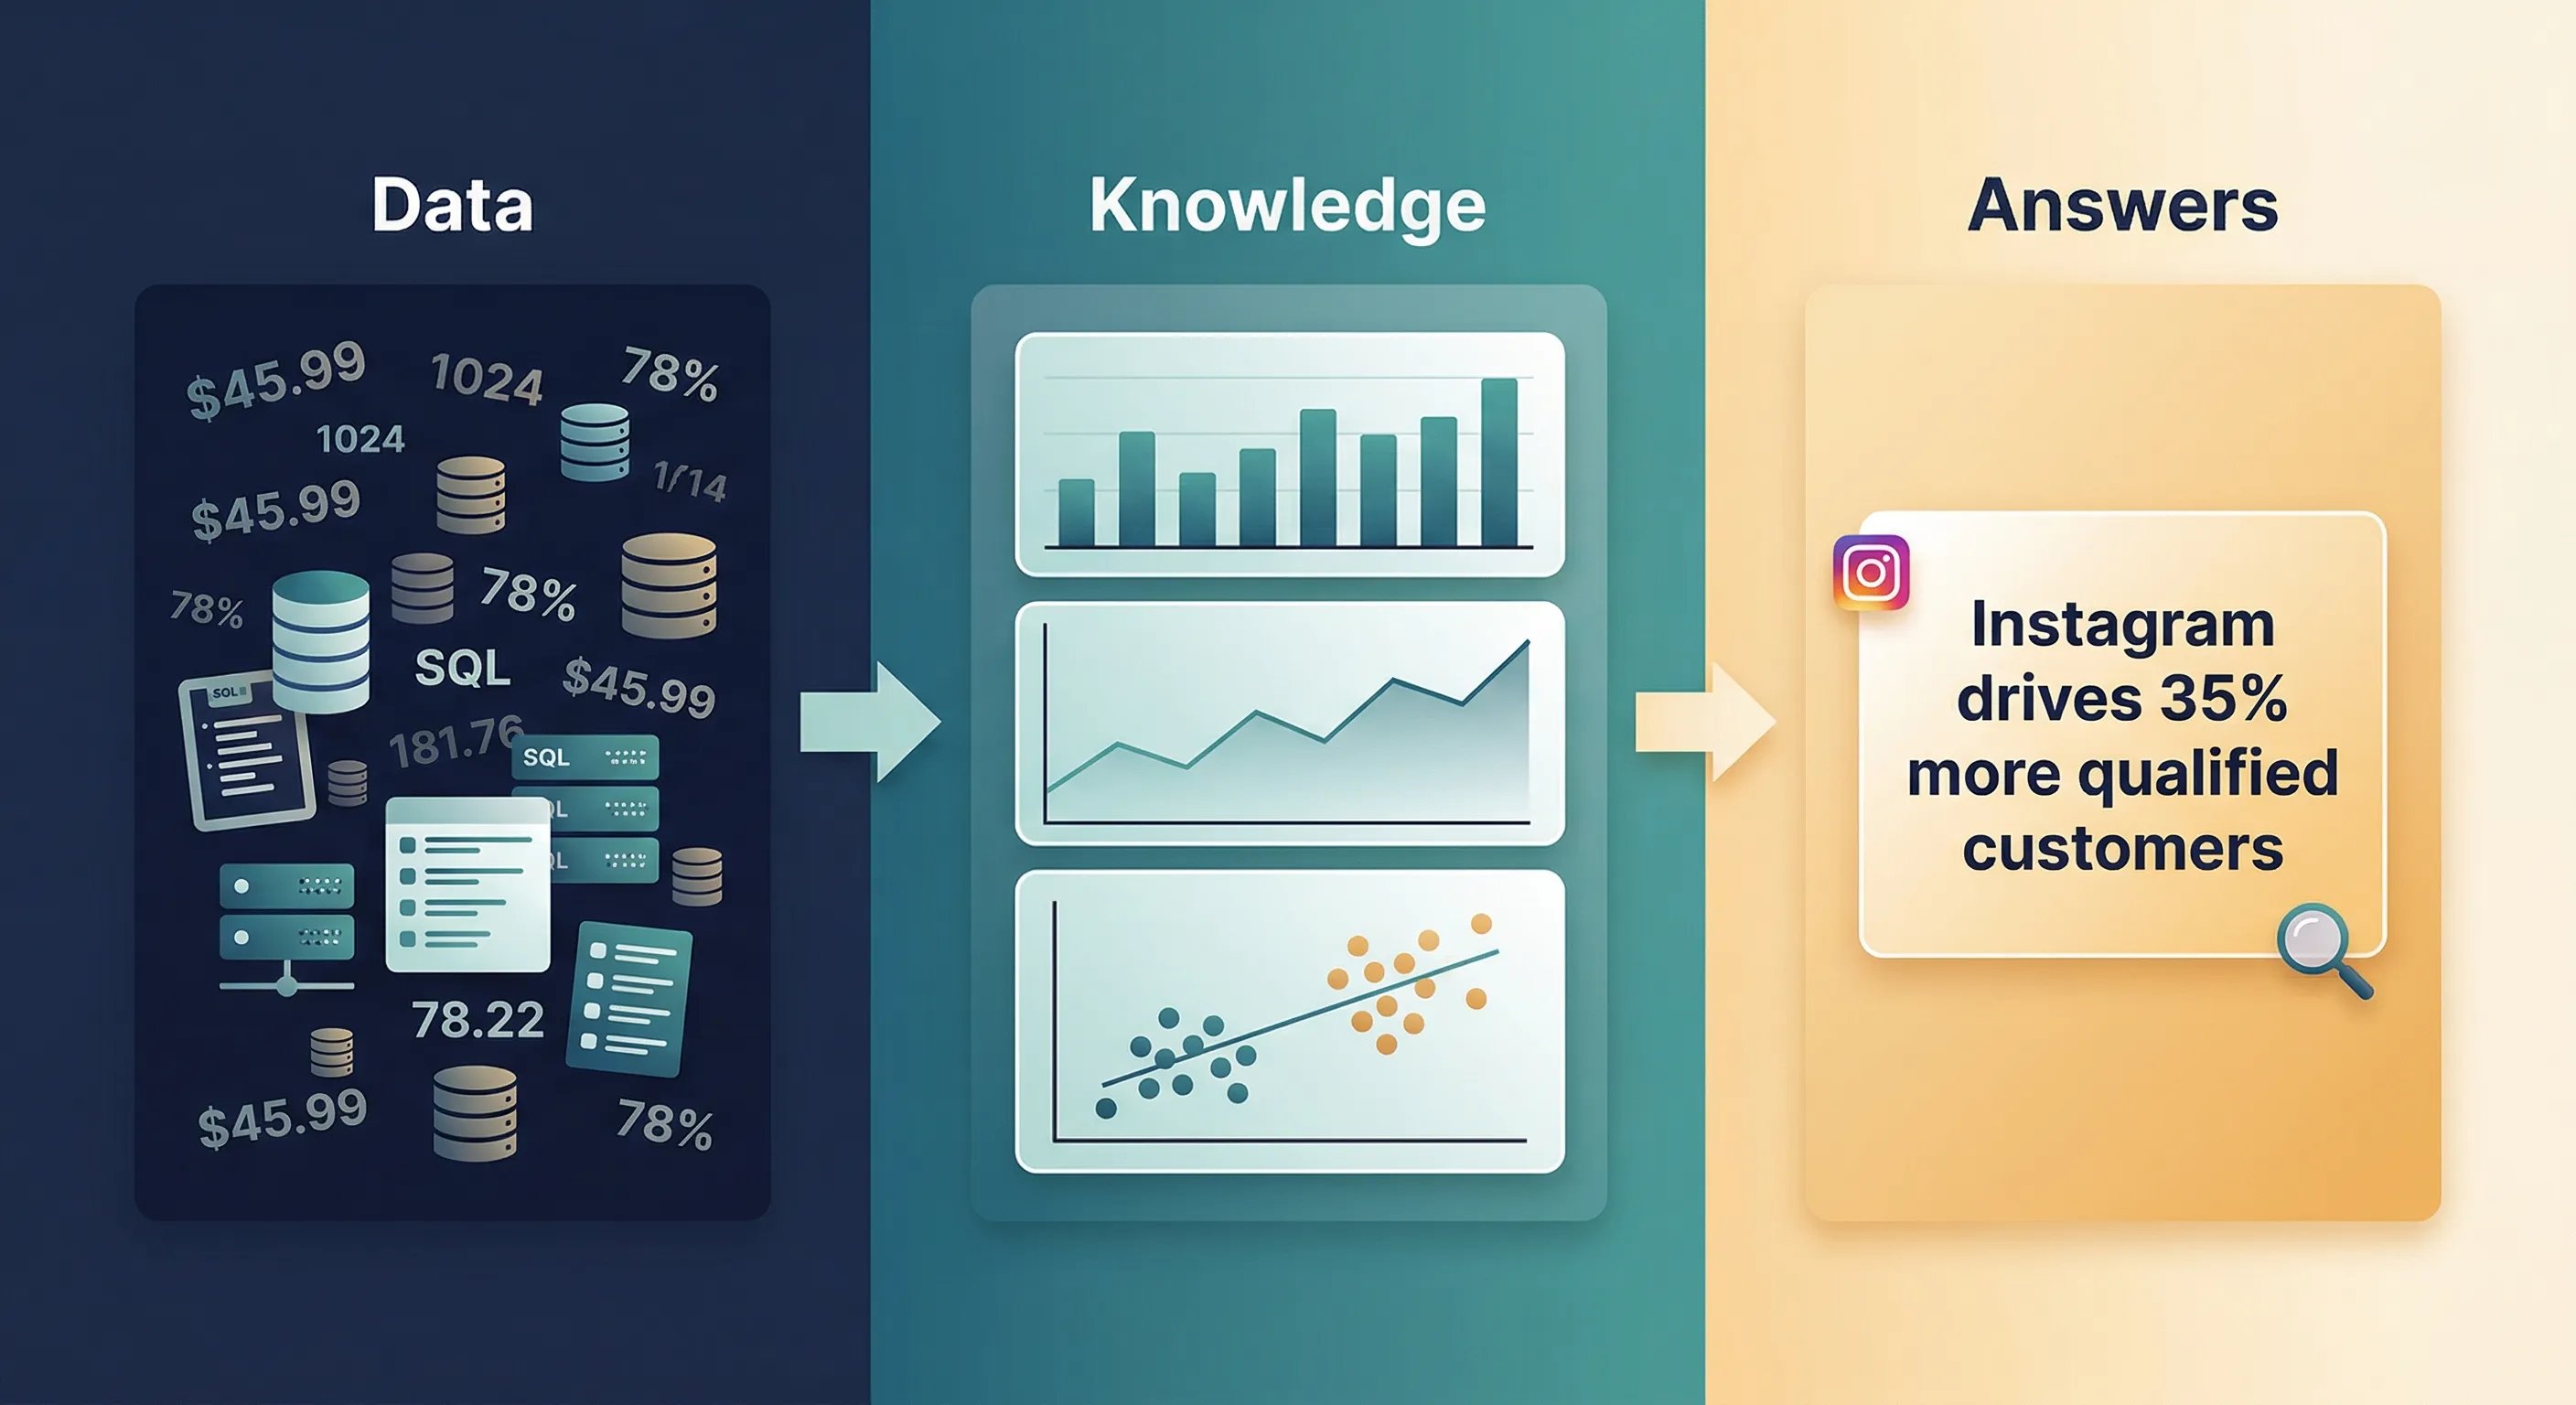
The Flow in Practice:
- Data: The raw metrics, dimensions, and information you collect
- Knowledge: Effective representation of the data (the type of chart, use of colour, etc)
- Answers: The clear, compelling conclusions (Actionable Insights) that directly answer the KPQs
KPQs are powerful because they ensure every step of this Data → Knowledge → Answers flow is purposeful. You collect only relevant data, represent it in ways that illuminate insights, and get clear answers that drive decisions.
Example of Meridian Threads’ Data → Knowledge → Answers Flow:
Question: “Which marketing channels are most effective at driving qualified customers for Meridian Threads?”
Data Collection:
- Metrics: Customer acquisition volume, purchase conversion rate, average order value, customer lifetime value, time to first purchase
- Dimensions: Traffic source (Google Ads, Instagram, email, organic search), campaign type, customer demographics
- Data Sources: Google Analytics 4, Shopify analytics, email marketing platform, social media insights
Knowledge (Data Representation):
- Conversion funnel analysis comparing Instagram vs. Google Ads vs. email marketing
- Customer lifetime value comparison table by traffic source
- Cost-per-acquisition vs. average order value scatter plot
- Time-series showing seasonal performance trends by channel
Answer: Instagram drives 35% more qualified customers than Google Ads, with a 20% higher average order value ($102 vs $85) and 40% better customer retention rates, making it Meridian Threads’ most effective channel for sustainable growth.
The AnD process only generates truly actionable insights because it’s grounded in clear Business Outcomes and mapped Behaviours that achieve them. Without this foundation, the AnD process might produce interesting observations, but not actionable insights.
Step 4: Actions From Answers (Actionable Insights) – What Does ITDO?
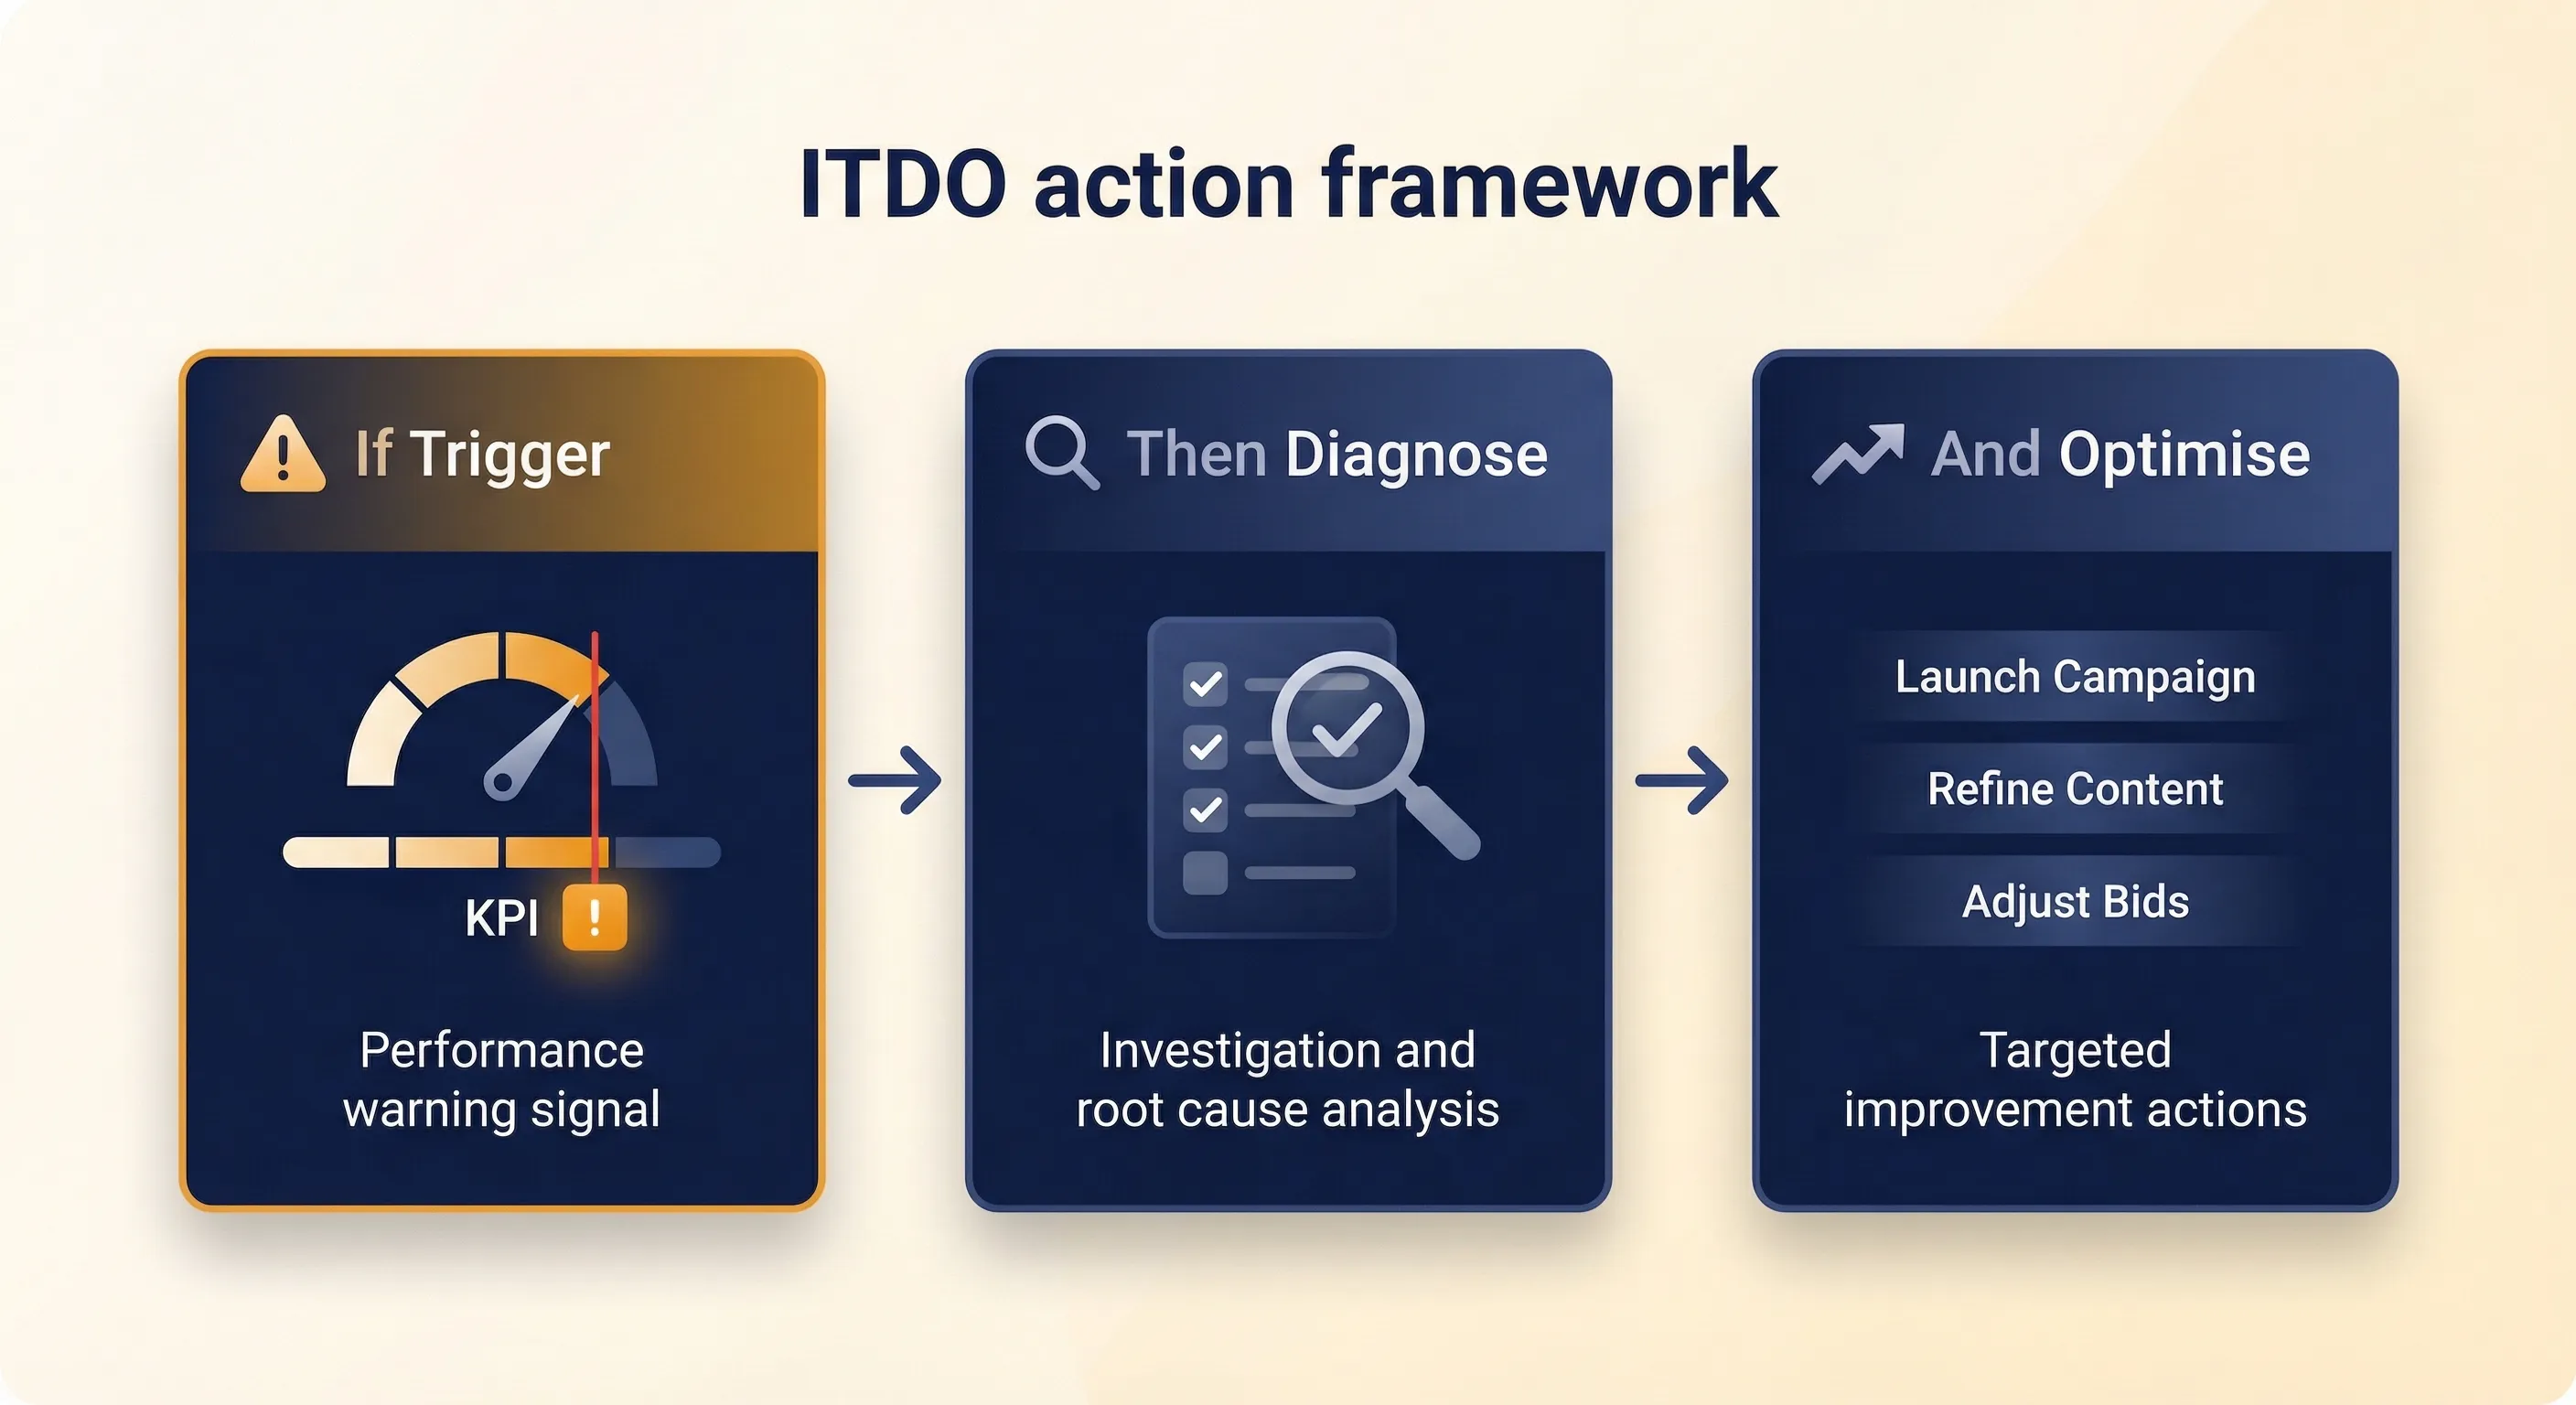
Now that you understand how the AnD process generates answers from your questions, the final step is turning those answers into concrete actions. This is where the If Trigger, the Diagnose and Optimise (ITDO) framework operationalises the “Action” component of the QnA cycle.
The ITDO framework creates clear action protocols based on KPI performance, ensuring that every insight leads to specific business actions.
If Trigger
Define the condition that signals action is needed. This is typically a KPI crossing a threshold – a drop below a target, a spike above normal, or a trend moving in the wrong direction for two or more periods.
Then Diagnose
Before acting, understand why the trigger fired. Work through a short checklist of possible causes so you’re solving the real problem, not just reacting to a symptom.
And Optimise
With the cause identified, apply a specific tactic to improve performance. The goal is a concrete change – not a vague intention to “do better.”
Meridian Threads ITDO Examples
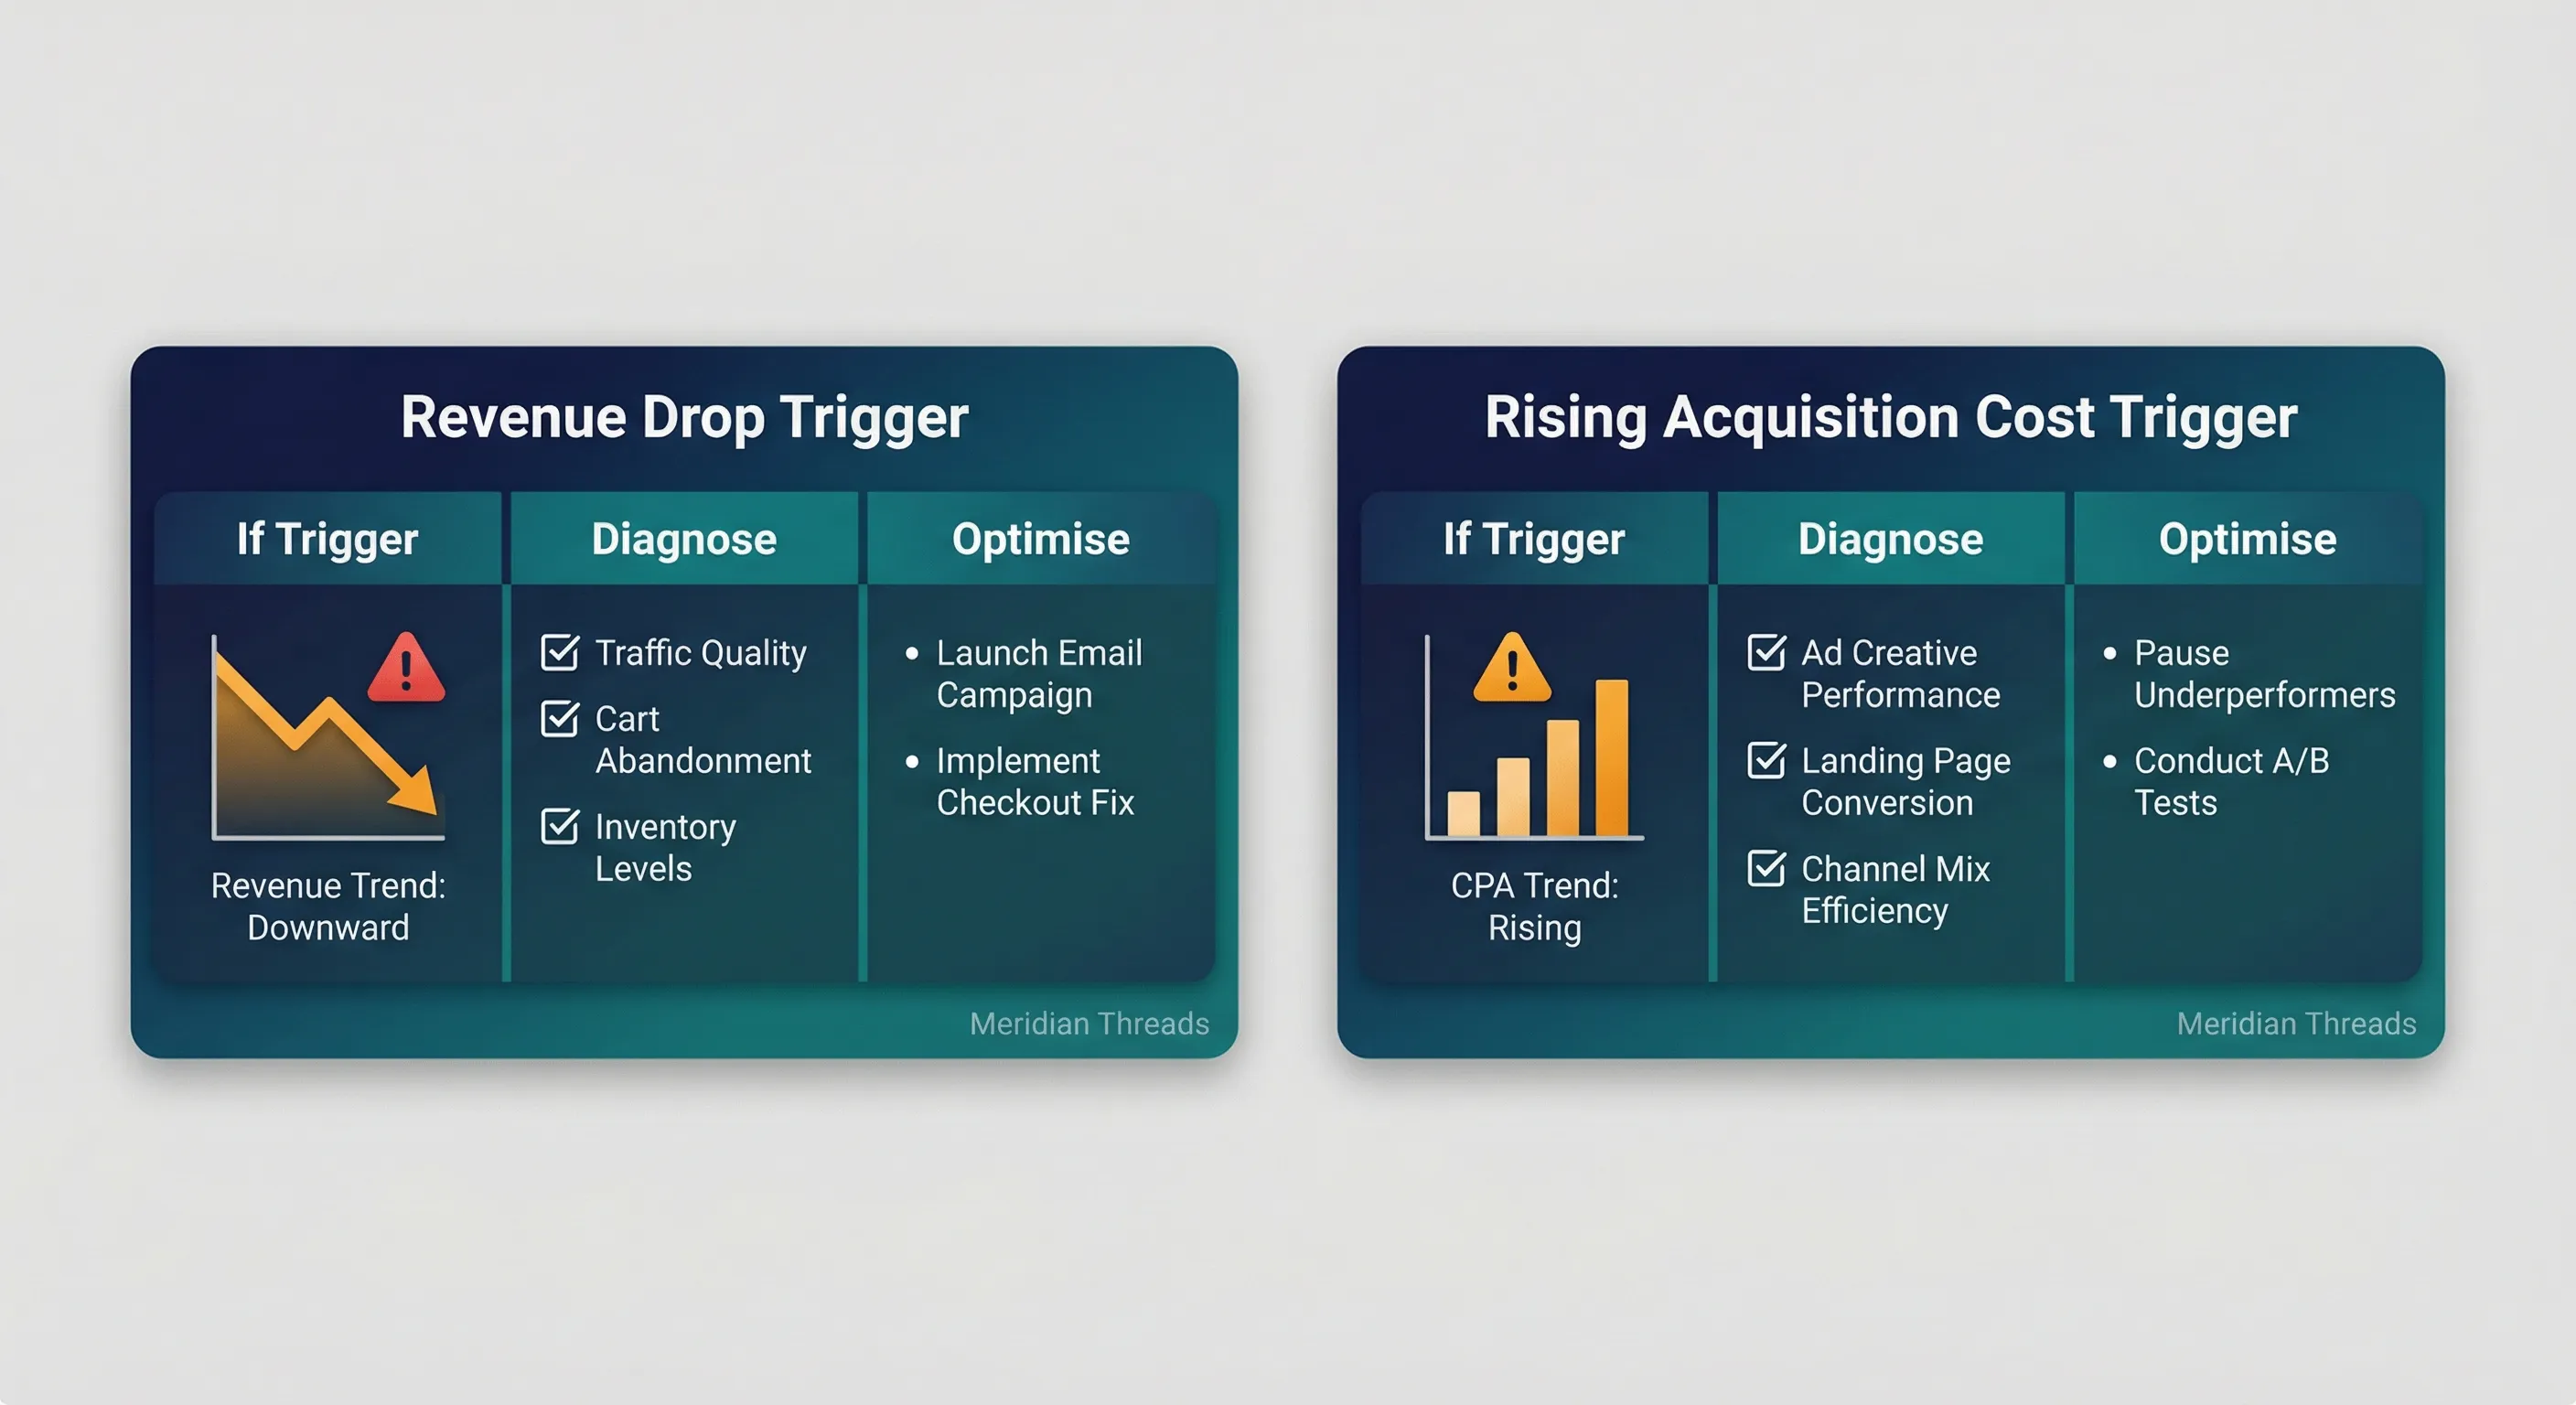
Revenue Performance Trigger:
- If Trigger: Weekly revenue drops 15% below the same week last year
- Then Diagnose: Review traffic quality by source, analyze cart abandonment rates, check for website technical issues, examine inventory availability for top products
- And Optimise: Launch targeted email campaign to recent browsers, optimize checkout process, restock popular items, increase social media promotion
Customer Acquisition Trigger:
- If Trigger: Cost per acquisition rises above $30 for two consecutive weeks
- Then Diagnose: Analyze which traffic sources are driving up costs, review ad creative performance, examine landing page conversion rates
- And Optimise: Pause underperforming ad campaigns, A/B test new creative variations, optimize landing pages for mobile users
Customer Engagement Trigger:
If Trigger: Average session duration falls below 2.5 minutes for organic traffic
Then Diagnose: Examine which pages have high bounce rates, review site speed performance, analyse user flow patterns, check mobile experience
And Optimise: Improve product page loading speed, enhance mobile navigation, add related product recommendations, create more engaging product descriptions
The ITDO framework ensures that your measurement strategy doesn’t stop at insights – it extends all the way to specific business actions that drive their outcomes.
Selecting Your Key Performance Indicators (KPIs)
KPI selection is where you begin implementing the Knowledge stage of the AnD flow. The KPIs you choose determine which metrics appear on your dashboard and how they are presented – the foundation of turning data into answers.
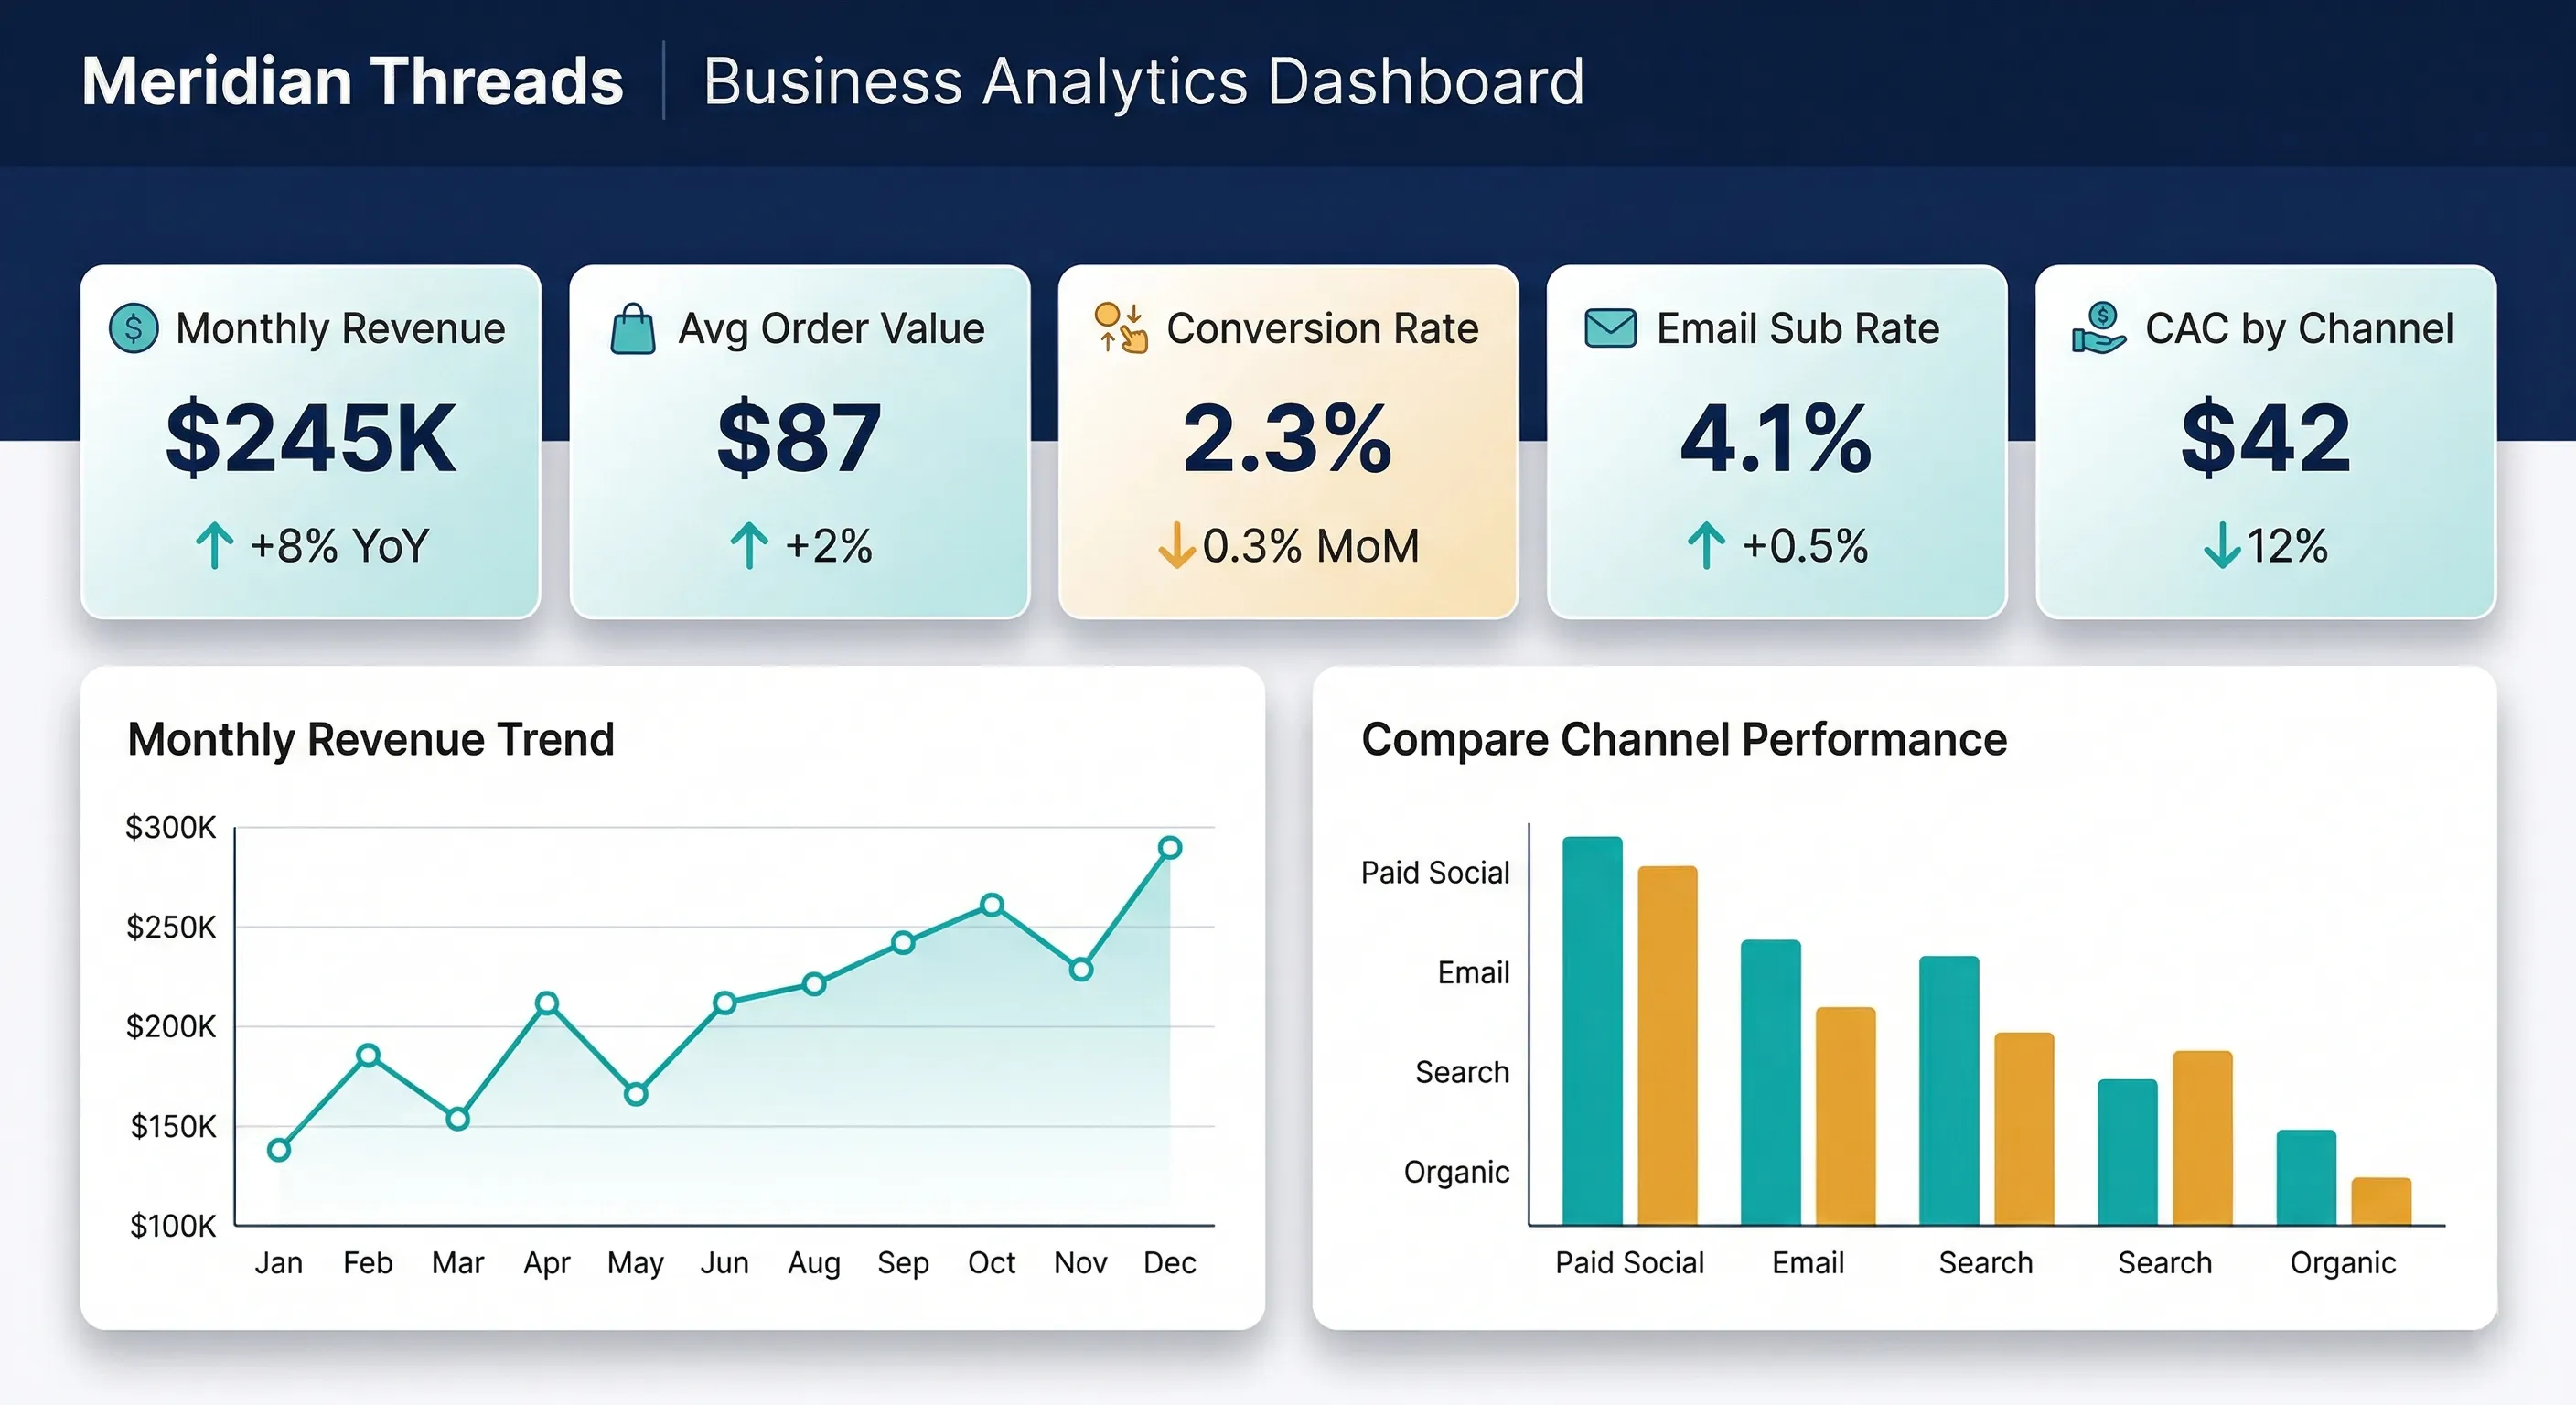
Think of your KPIs as the 3-5 metrics displayed as score cards at the top of your dashboard – the first things you check every time you log in. These aren’t just any metrics; they’re your strategic early warning system that tells you instantly whether your business is winning or needs attention.
What Gets Checked First
Your KPIs serve as your business health check. Just like a doctor doesn’t need to run every possible test to assess your overall health, you don’t need to monitor hundreds of metrics to understand your business performance. But you do need the right vital signs that answer your most critical question: “How is my business performing, and where should I focus my attention?”
The Three Pillars of Effective KPI Selection
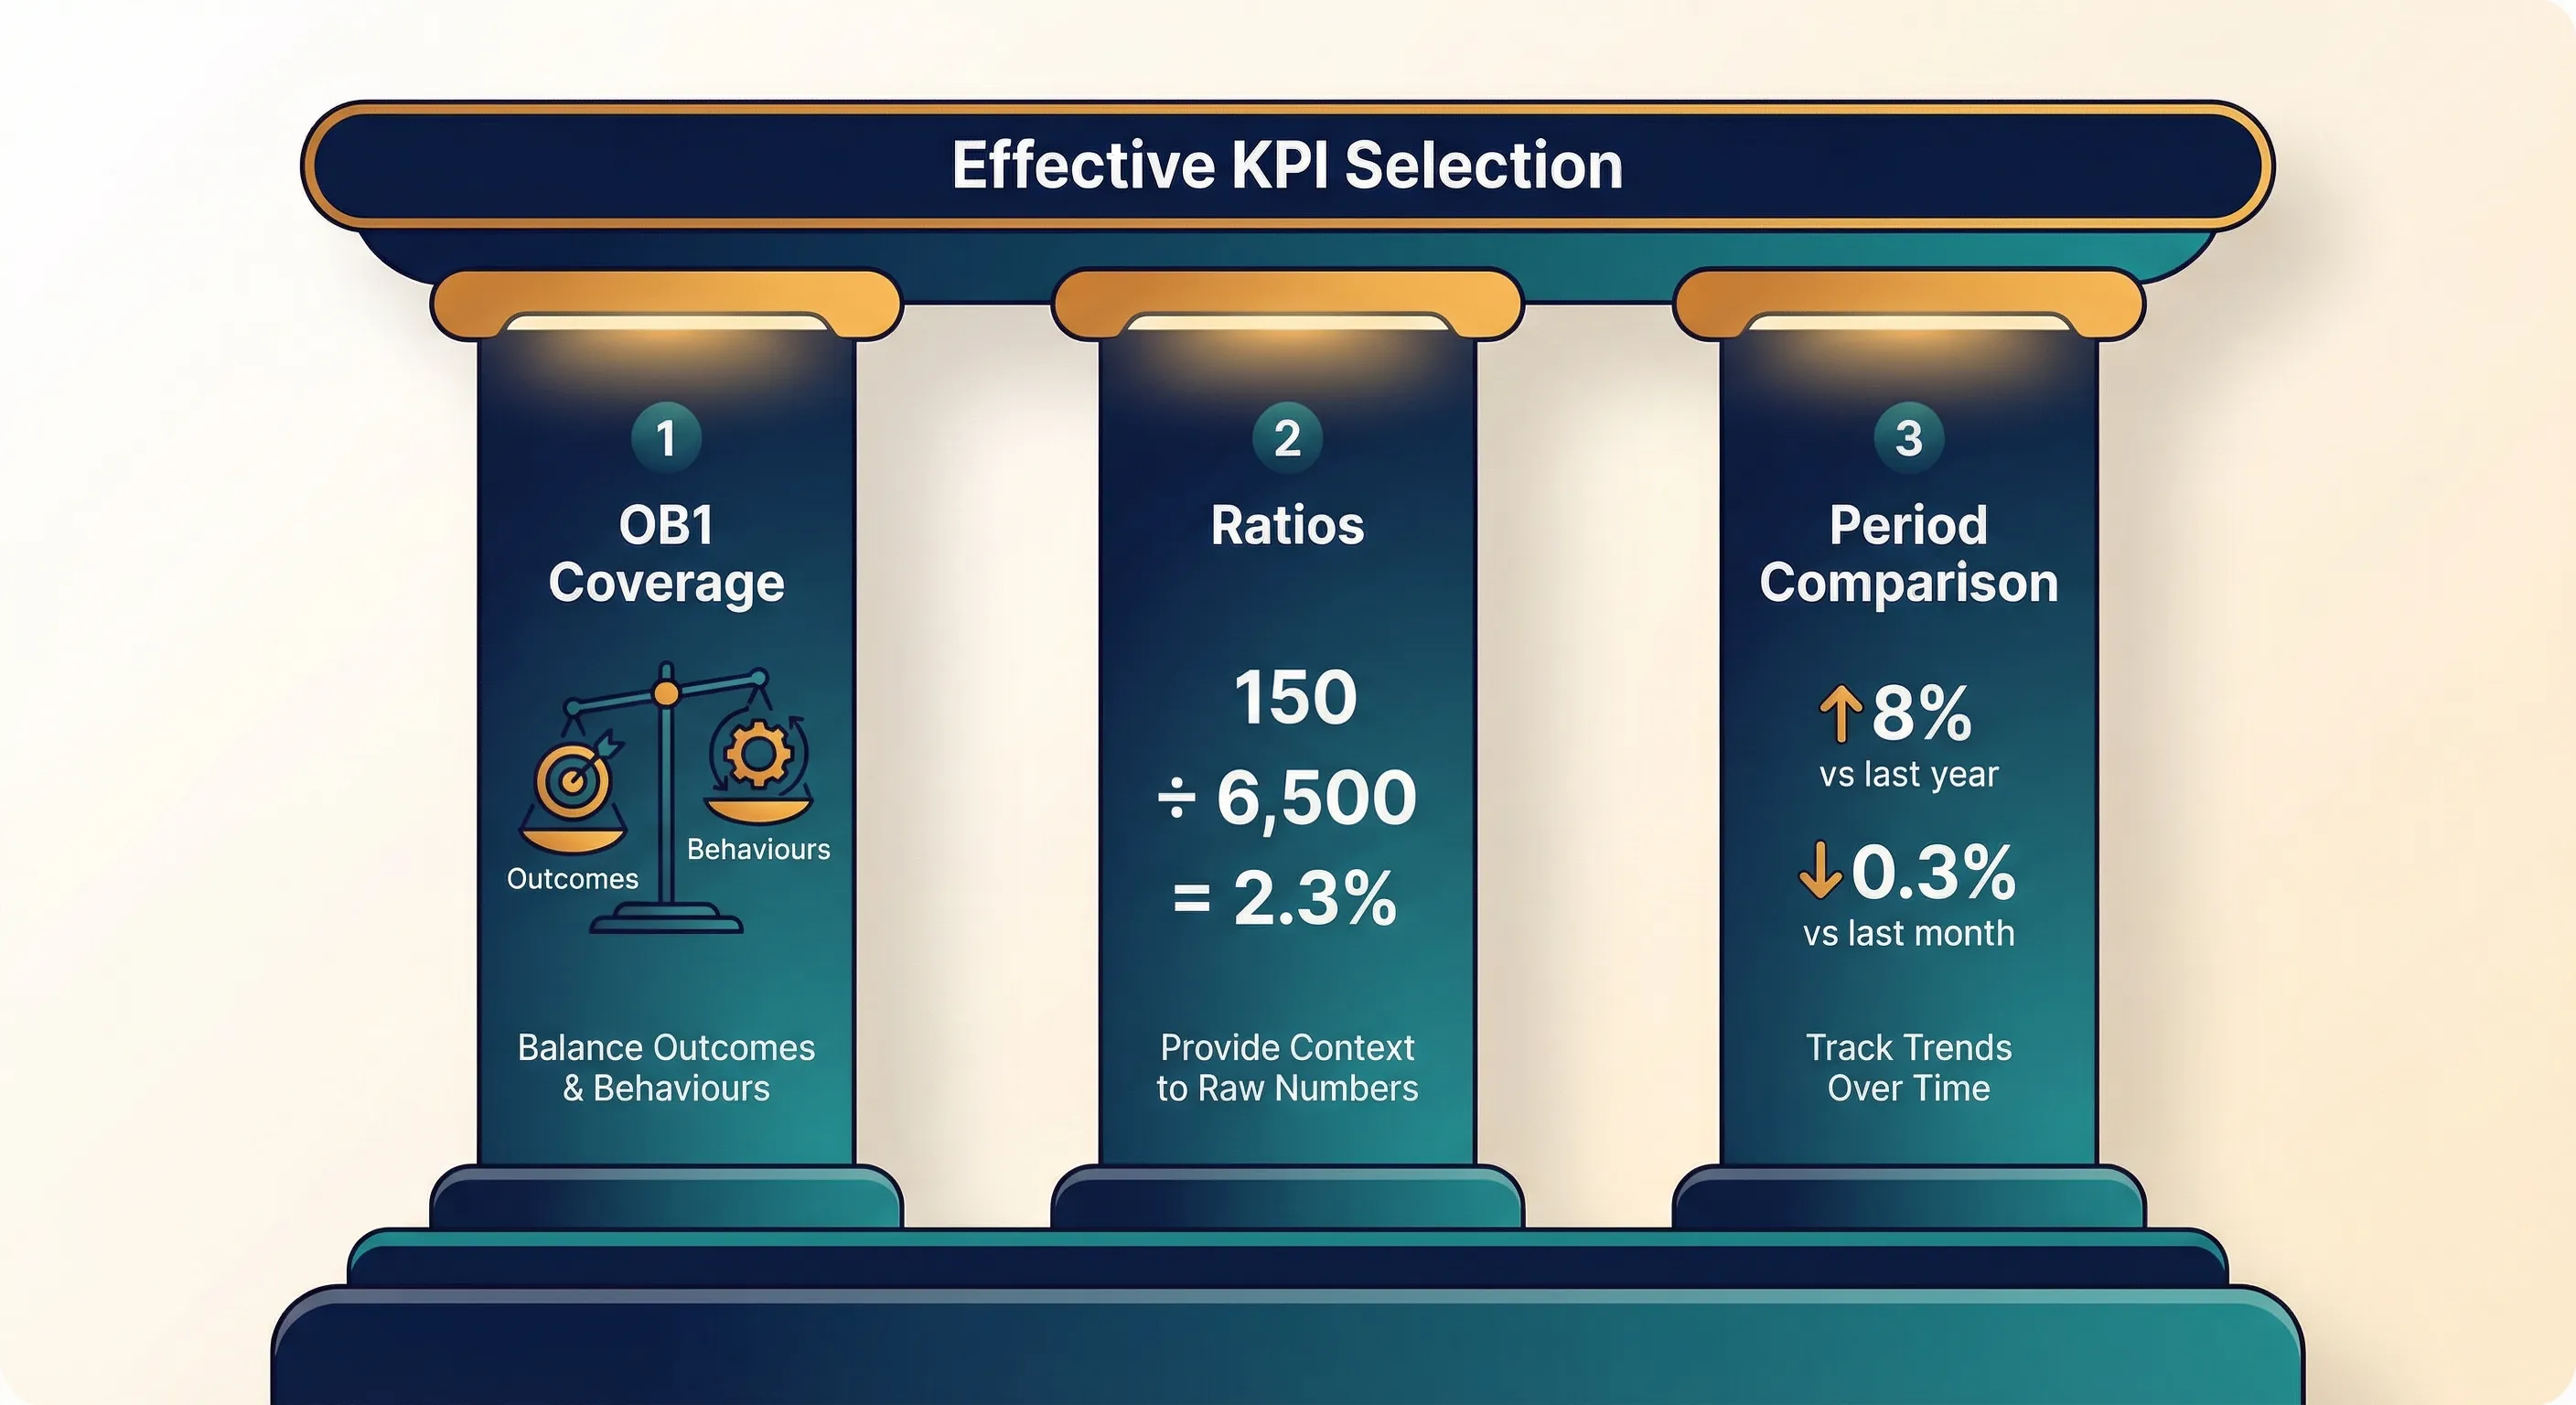
Pillar 1: Complete OB1 Coverage
Your scorecard must give you visibility across both your desired Outcomes and the Behaviours that drive them. This ensures you have both leading indicators (behaviours) and lagging indicators (outcomes) to guide your decision-making.
Outcome KPIs measure what you’re trying to achieve:
- Revenue growth rate, lead generation volume, customer acquisition numbers, retention rates
Behaviour KPIs measure the actions that create those outcomes:
- User engagement patterns, content consumption rates, feature adoption rates, customer interaction frequency
For Web Businesses – Apply OB1 Through ARC: Web behaviours follow the predictable ARC journey, so ensure coverage across:
- Aware (Discovery Behaviours): Quality traffic acquisition metrics
- Review (Evaluation Behaviours): Engagement and consideration metrics
- Convert (Conversion Behaviours): Action completion metrics that drive outcomes
Pillar 2: Ratios Provide Context for Raw Numbers
While raw numbers tell you what happened, ratios tell you how effectively it happened. The most powerful KPIs combine both for complete insight.
Why Ratios Add Essential Context:
- Effectiveness Measurement: 100 conversions could be great (from 1,000 sessions) or concerning (from 10,000 sessions)
- Fair Comparisons: A 2% conversion rate can be compared across different traffic volumes and time periods
- Optimisation Direction: Rising sessions with falling conversion rate signals different actions than falling sessions with stable conversion rate
Powerful KPI Combinations:
- Conversion Performance: “150 conversions (2.3% rate, ↓0.3% vs last month)”
- Traffic Quality: “45,000 sessions (+12% growth, 65% engagement rate)”
- Revenue Efficiency: “$50,000 revenue ($2.15 per visitor, +8% vs last year)”
- Acquisition Cost: “200 new customers ($45 CAC, 15% under target)”
The ratio provides the context that makes the raw number actionable.
Pillar 3: Period-Over-Period Context
A KPI without context is just a number. Your dashboard should show “Conversion rate: 2.3% (↓15% vs last month, ↑8% vs last year)” not just “Conversion rate: 2.3%.”
Focus on month-over-month for trends, year-over-year for seasonal patterns, and week-over-week for urgent issues.
The KPI Selection Process
1: From KPQs to KPI Requirements
Your KPIs must be able to answer your most critical KPQs. Here’s how Meridian Threads’ core questions directly determine their KPI needs:
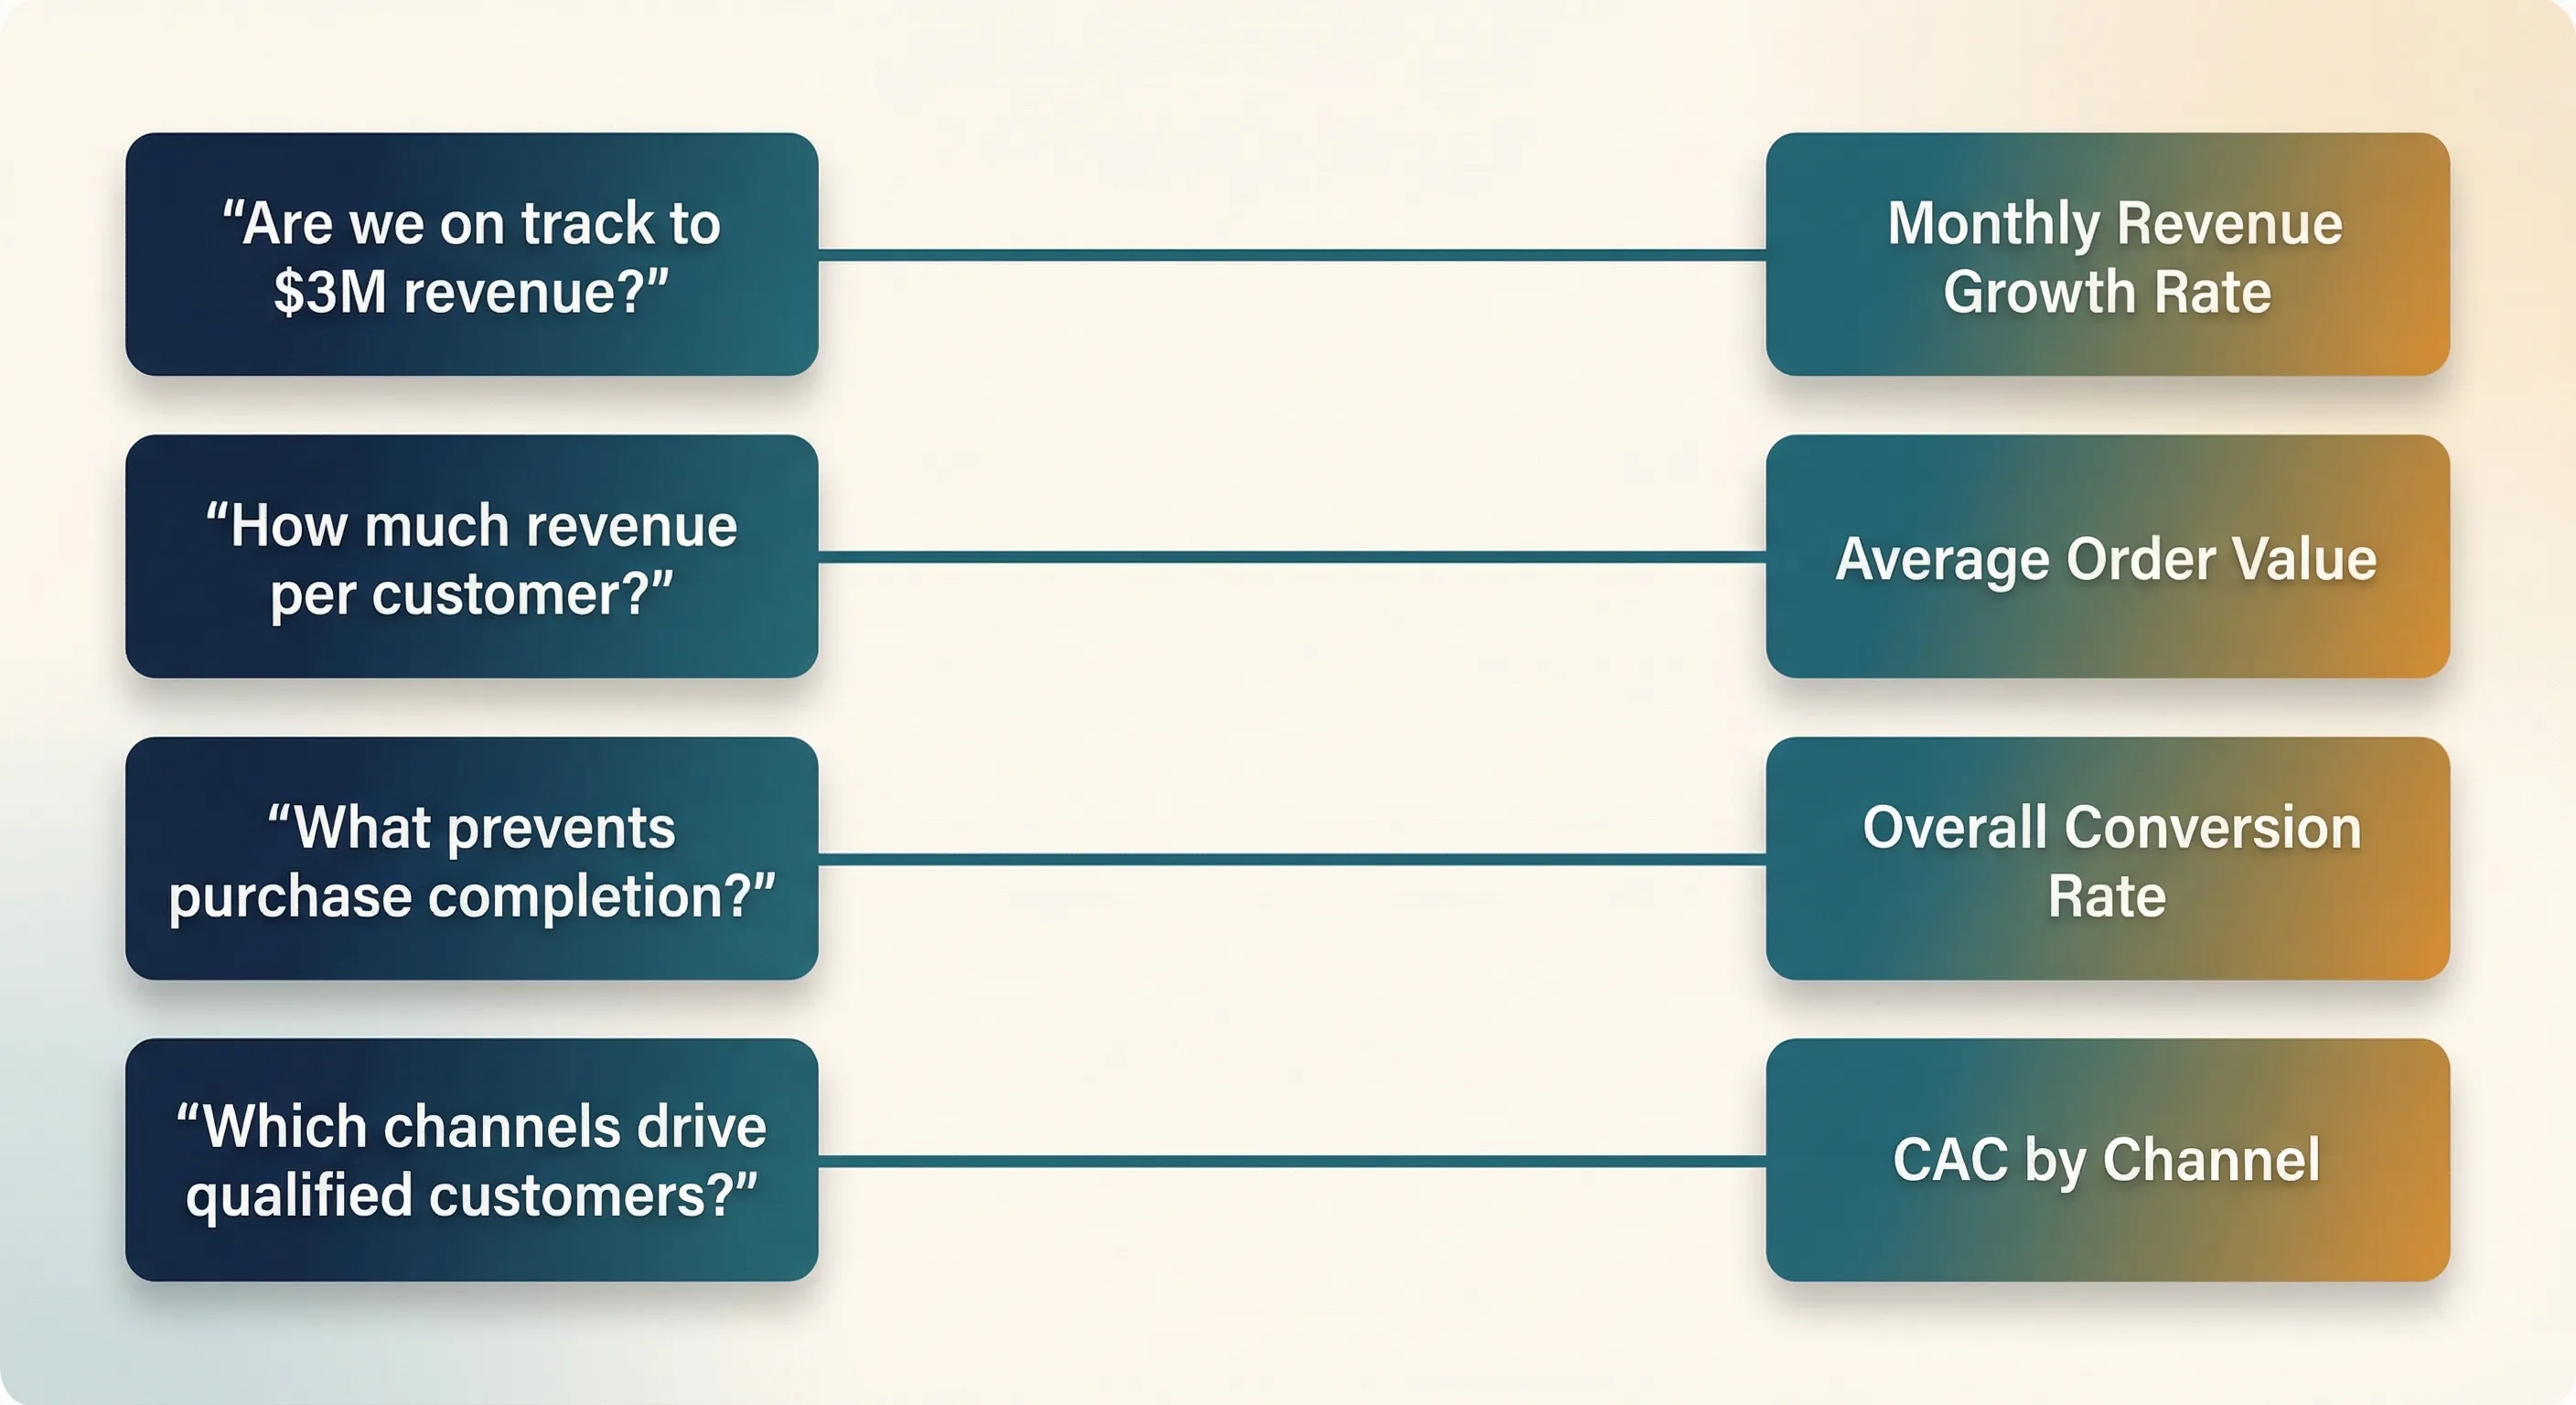
KPQ → KPI Mapping for Meridian Threads:
- “Are we on track to reach our $3M annual revenue goal?” → Requires: Monthly Revenue Growth Rate KPI (tracks progress toward annual target)
- “How much revenue are we generating per customer acquired?” → Requires: Average Order Value KPI (measures revenue efficiency per transaction)
- “Which obstacles prevent more visitors from completing their purchase?” → Requires: Overall Conversion Rate KPI (identifies conversion effectiveness across all touchpoints)
- “How quickly do email subscribers make their first purchase?” → Requires: Email Subscription Rate KPI (measures lead generation quality from website traffic)
- “Which marketing channels are most effective at driving qualified customers?” → Requires: Customer Acquisition Cost by Channel KPI (ensures sustainable, profitable growth)
This direct KPQ-to-KPI mapping ensures Meridian Threads can answer their most important questions just by checking their dashboard.
2: Map Your Current OB1 Performance
Assess where you stand:
- What outcomes are you trying to achieve, and how are you performing?
- What behaviours drive those outcomes, and where are the opportunities?
- Which aspects need the most attention?
3: Choose KPIs That Balance Outcomes and Behaviours
Outcome KPIs:
- Monthly Revenue Growth Rate (answers: “Are we on track to $3M?”)
- Average Order Value (answers: “How much revenue per customer?”)
Behaviour KPIs:
- Overall Conversion Rate (answers: “What prevents purchase completion?”)
- Email Subscription Rate (answers: “How quickly do subscribers convert?”)
For Web Businesses: Select across Aware (traffic acquisition), Review (engagement), and Convert (completion) stages.
4: Add 1-2 Supporting KPIs
Meridian Threads’ Supporting KPI:
Customer Acquisition Cost by Channel (answers: “Which channels drive qualified customers?”)
5: Validate Your Selection
- OB1 Coverage: Can you see both Outcomes and driving Behaviours?
- Action Trigger: If any KPI changes significantly, do you know what to investigate?
- Leading/Lagging Balance: Mix of predictive behaviours and results?
- Comparison Ready: Easy to track trends across time periods?
Each of Meridian Threads’ KPIs connects directly to their ITDO triggers:
- Revenue Growth triggers marketing campaign optimizations
- AOV performance triggers product bundling and upselling tests
- Conversion Rate triggers checkout and user experience improvements
- Email Subscription triggers content and lead magnet optimizations
- CAC by Channel triggers budget reallocation and campaign adjustments
This creates a seamless flow: KPQs → AnD → KPI Selection → ITDO Actions
Why This Framework Works
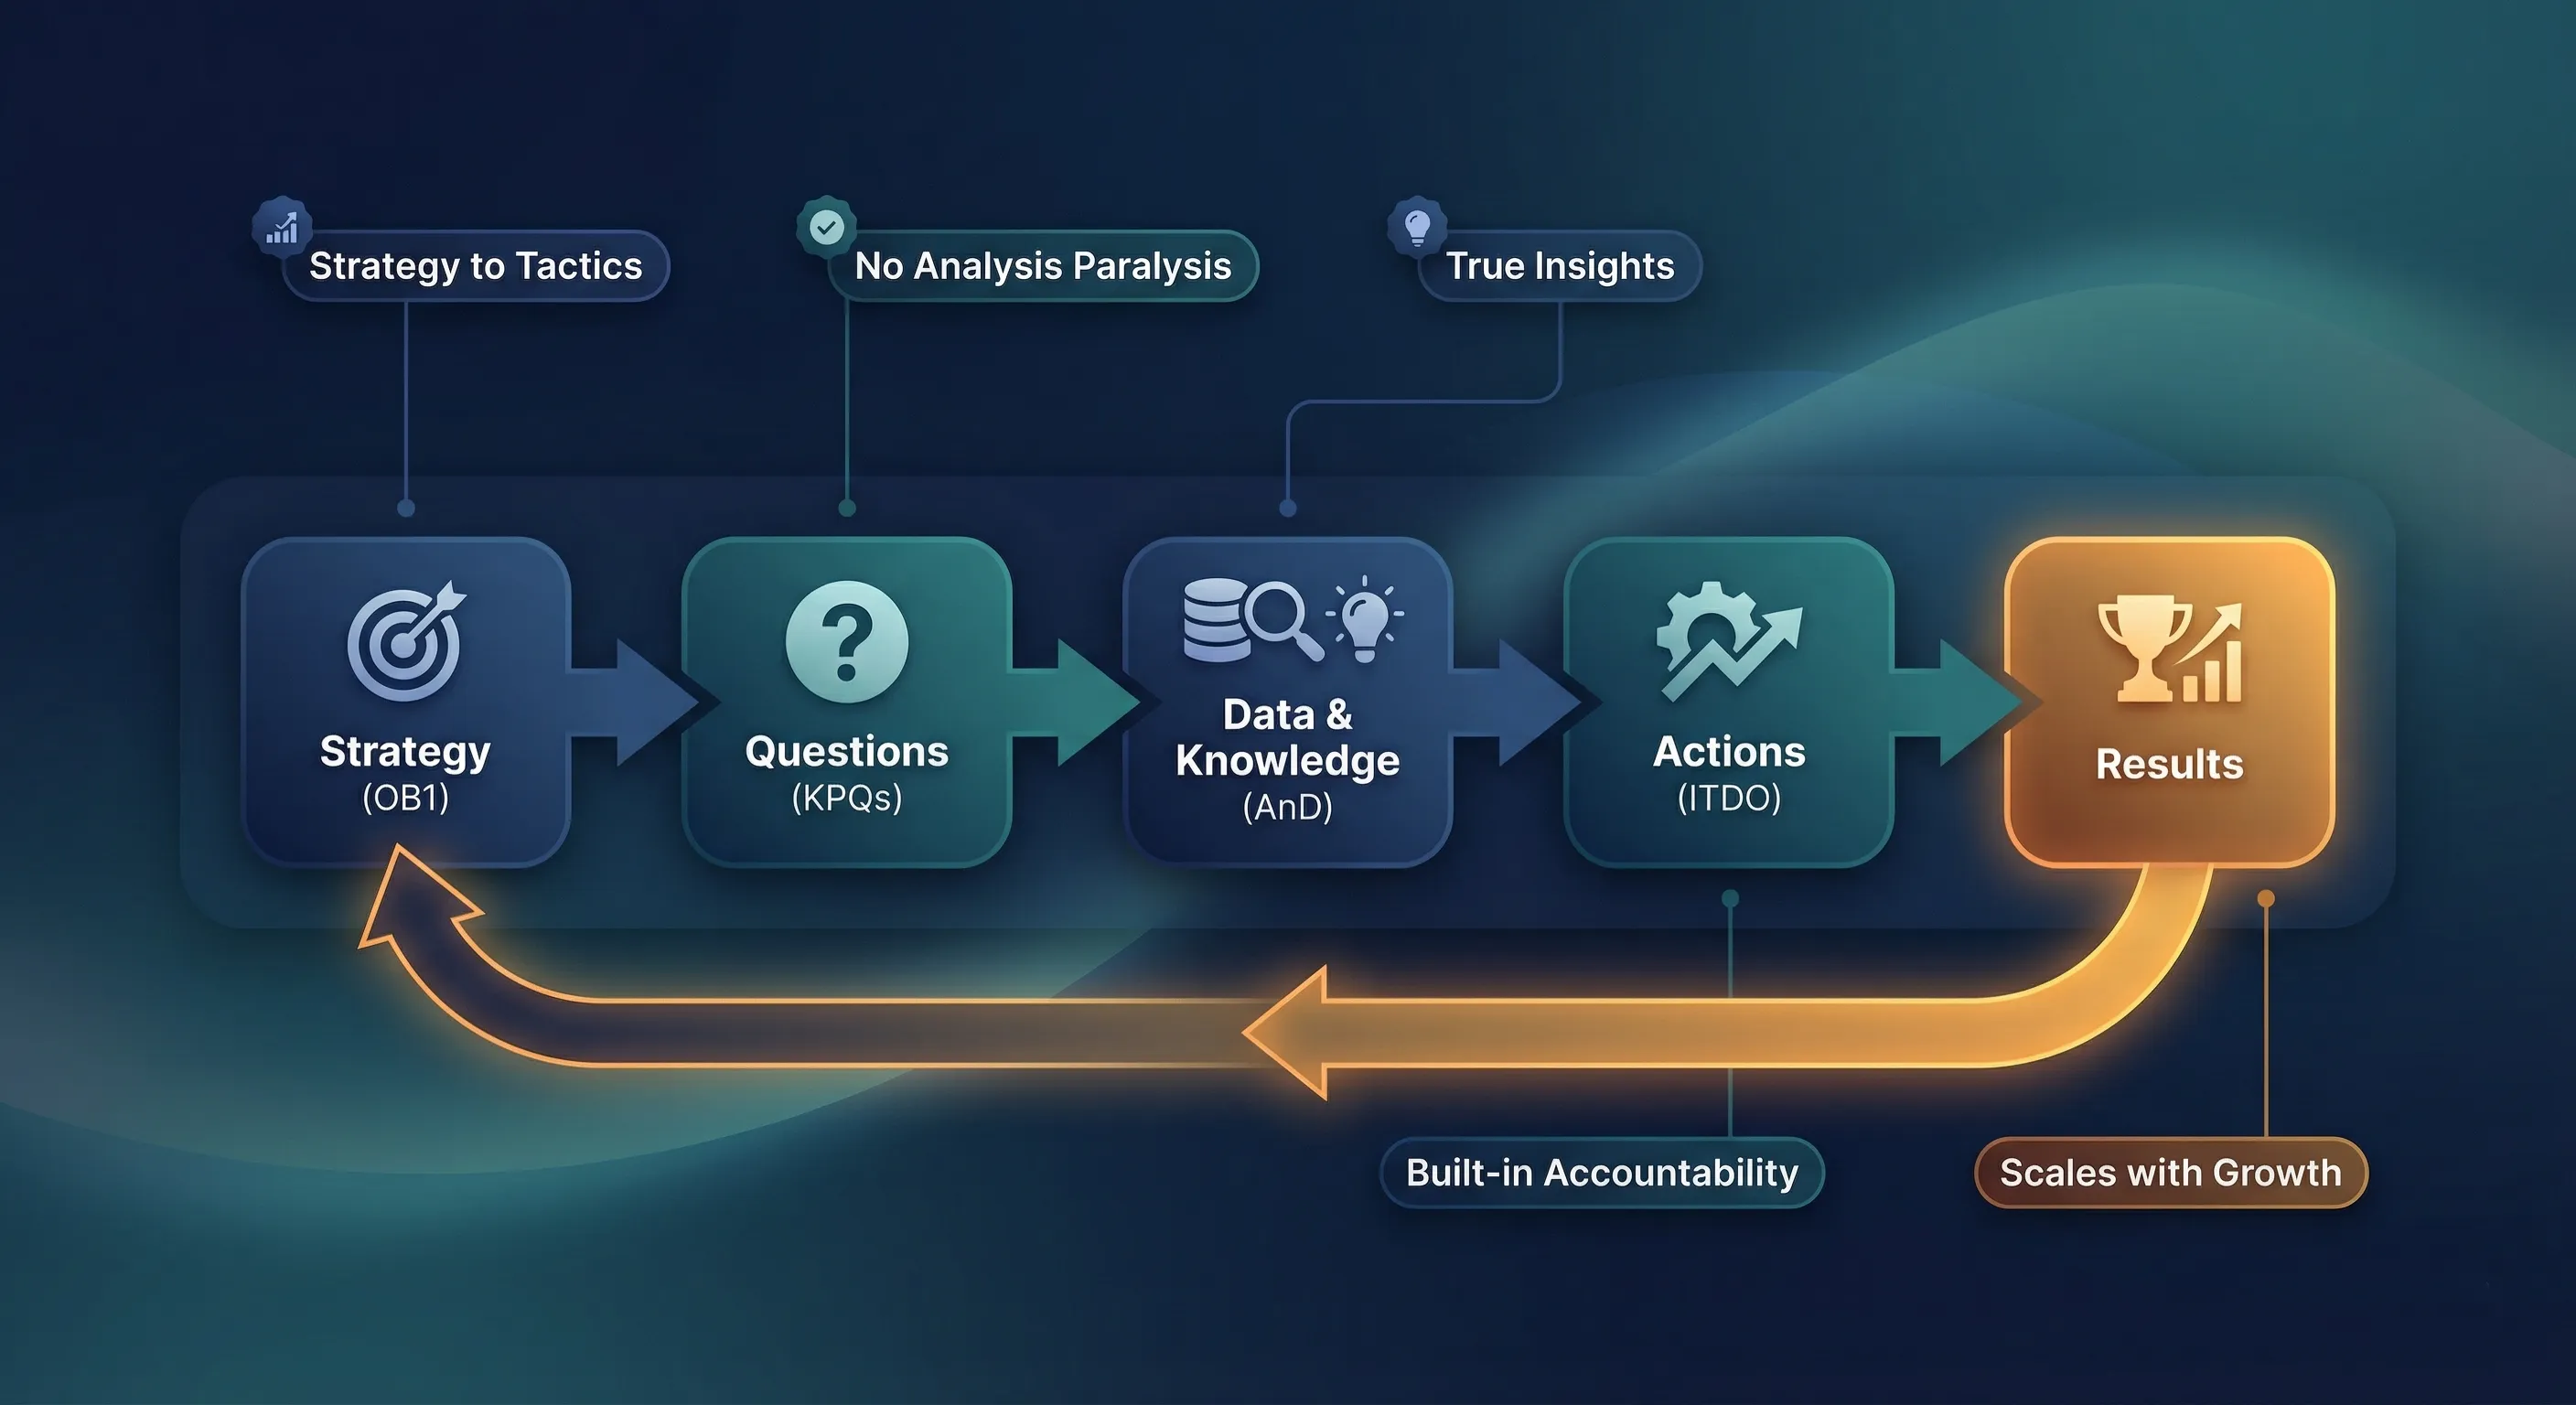
The Actionable Measurement Framework succeeds because it:
- Connects Strategy to Tactics: Every measurement decision traces back to business outcomes, ensuring your analytics work supports your business goals.
- Prevents Analysis Paralysis: By focusing on KPQs and limiting KPIs, you avoid getting lost in irrelevant metrics.
- Generates True Actionable Insights: The AnD process, guided by clear business context, produces insights.
- Builds in Accountability: The ITDO framework ensures that insights lead to specific actions, not just interesting observations.
- Adapts to Business Evolution: As your business grows and changes, the framework scales with you, allowing for new outcomes, behaviours, and questions.
Next Steps
The Actionable Measurement Framework works across any domain, but if marketing is your focus, the next step is seeing it applied in practice. How to Build Your Marketing Measurement Foundation walks you through implementing the framework specifically for marketing, using the same OB1, QnA, and KPI principles you’ve just learned.
Conclusion
The Actionable Measurement Framework exists to solve one problem: the gap between having data and knowing what to do with it. By starting with Outcomes and Behaviours, asking the right questions, and defining your actions before you need them, you shift from reporting what happened to driving what happens next. The framework scales with your business – start with one Outcome, one set of KPQs, and one ITDO trigger, and build from there.
Frequently Asked Questions
Is The Actionable Measurement Framework just another term for finding “Actionable Insights”?
Not exactly. Finding actionable insights is a key outcome of the framework, specifically within the QnA Cycle.
However, the framework is a more complete system. It starts much earlier by aligning with business strategy (Outcomes and Behaviours 1st) and, most importantly, it formalizes what you do after you find an insight with the ITDO model (If Trigger then Diagnose and Optimise) to ensure action is taken.
Where exactly in the framework do I get the “Actionable Insights”?
You generate actionable insights in Step 2 of the QnA cycle, labeled “Answers ← Knowledge ← Data”.
An actionable insight is the “Answer” you uncover after asking the right Key Performance Question (KPQ) and representing the data effectively.