
When you set up tracking on your website or app, you’re trusting that everything works correctly. But what if a critical conversion event isn’t firing? What if your ecommerce data is malformed? Standard Google Analytics 4 (GA4) reports can take 24 to 48 hours to process, which means you could lose days of valuable data before discovering something’s broken.
GA4 DebugView solves this problem by showing you exactly what data your website or app is sending to GA4 in real-time. It’s a testing environment that isolates your specific device and displays every event, parameter, and user property as it happens. This guide walks you through everything you need to know:
- How to activate GA4 DebugView for websites and mobile apps.
- How to read the interface.
- How to validate complex implementations like ecommerce tracking.
- How to troubleshoot common issues that prevent data from appearing.
Table of Contents
Why GA4 DebugView Matters for Your Business
When you set up tracking for your website or app, you’re essentially asking Google Analytics to collect specific information about your visitors. But how do you know it’s actually working correctly?
Standard GA4 reports can take 24 to 48 hours to process your data. If something’s broken in your setup, you could lose two full days of data before you even realise there’s a problem. Even worse, you might make business decisions based on incomplete or incorrect information.
DebugView solves this by showing you exactly what’s happening right now. Think of it as looking under the bonnet whilst the engine is running, rather than waiting for a mechanic’s report two days later.
DebugView vs Realtime Reports: What’s the Difference?
Many people confuse DebugView with GA4’s Realtime report because both show current activity. However, they serve completely different purposes, and understanding this difference is crucial.
The Realtime Report: Your Traffic Monitor
The Realtime report shows you what’s happening across your entire website or app right now. It aggregates data from all your visitors into a single view, giving you insights like:
- How many people are on your site
- Which pages they’re viewing
- Where they’re coming from geographically
- Which traffic sources are currently driving visitors
This is brilliant for monitoring campaigns or seeing immediate responses to marketing activities. However, because it combines everyone’s data together, you can’t use it to test whether your tracking is set up correctly.
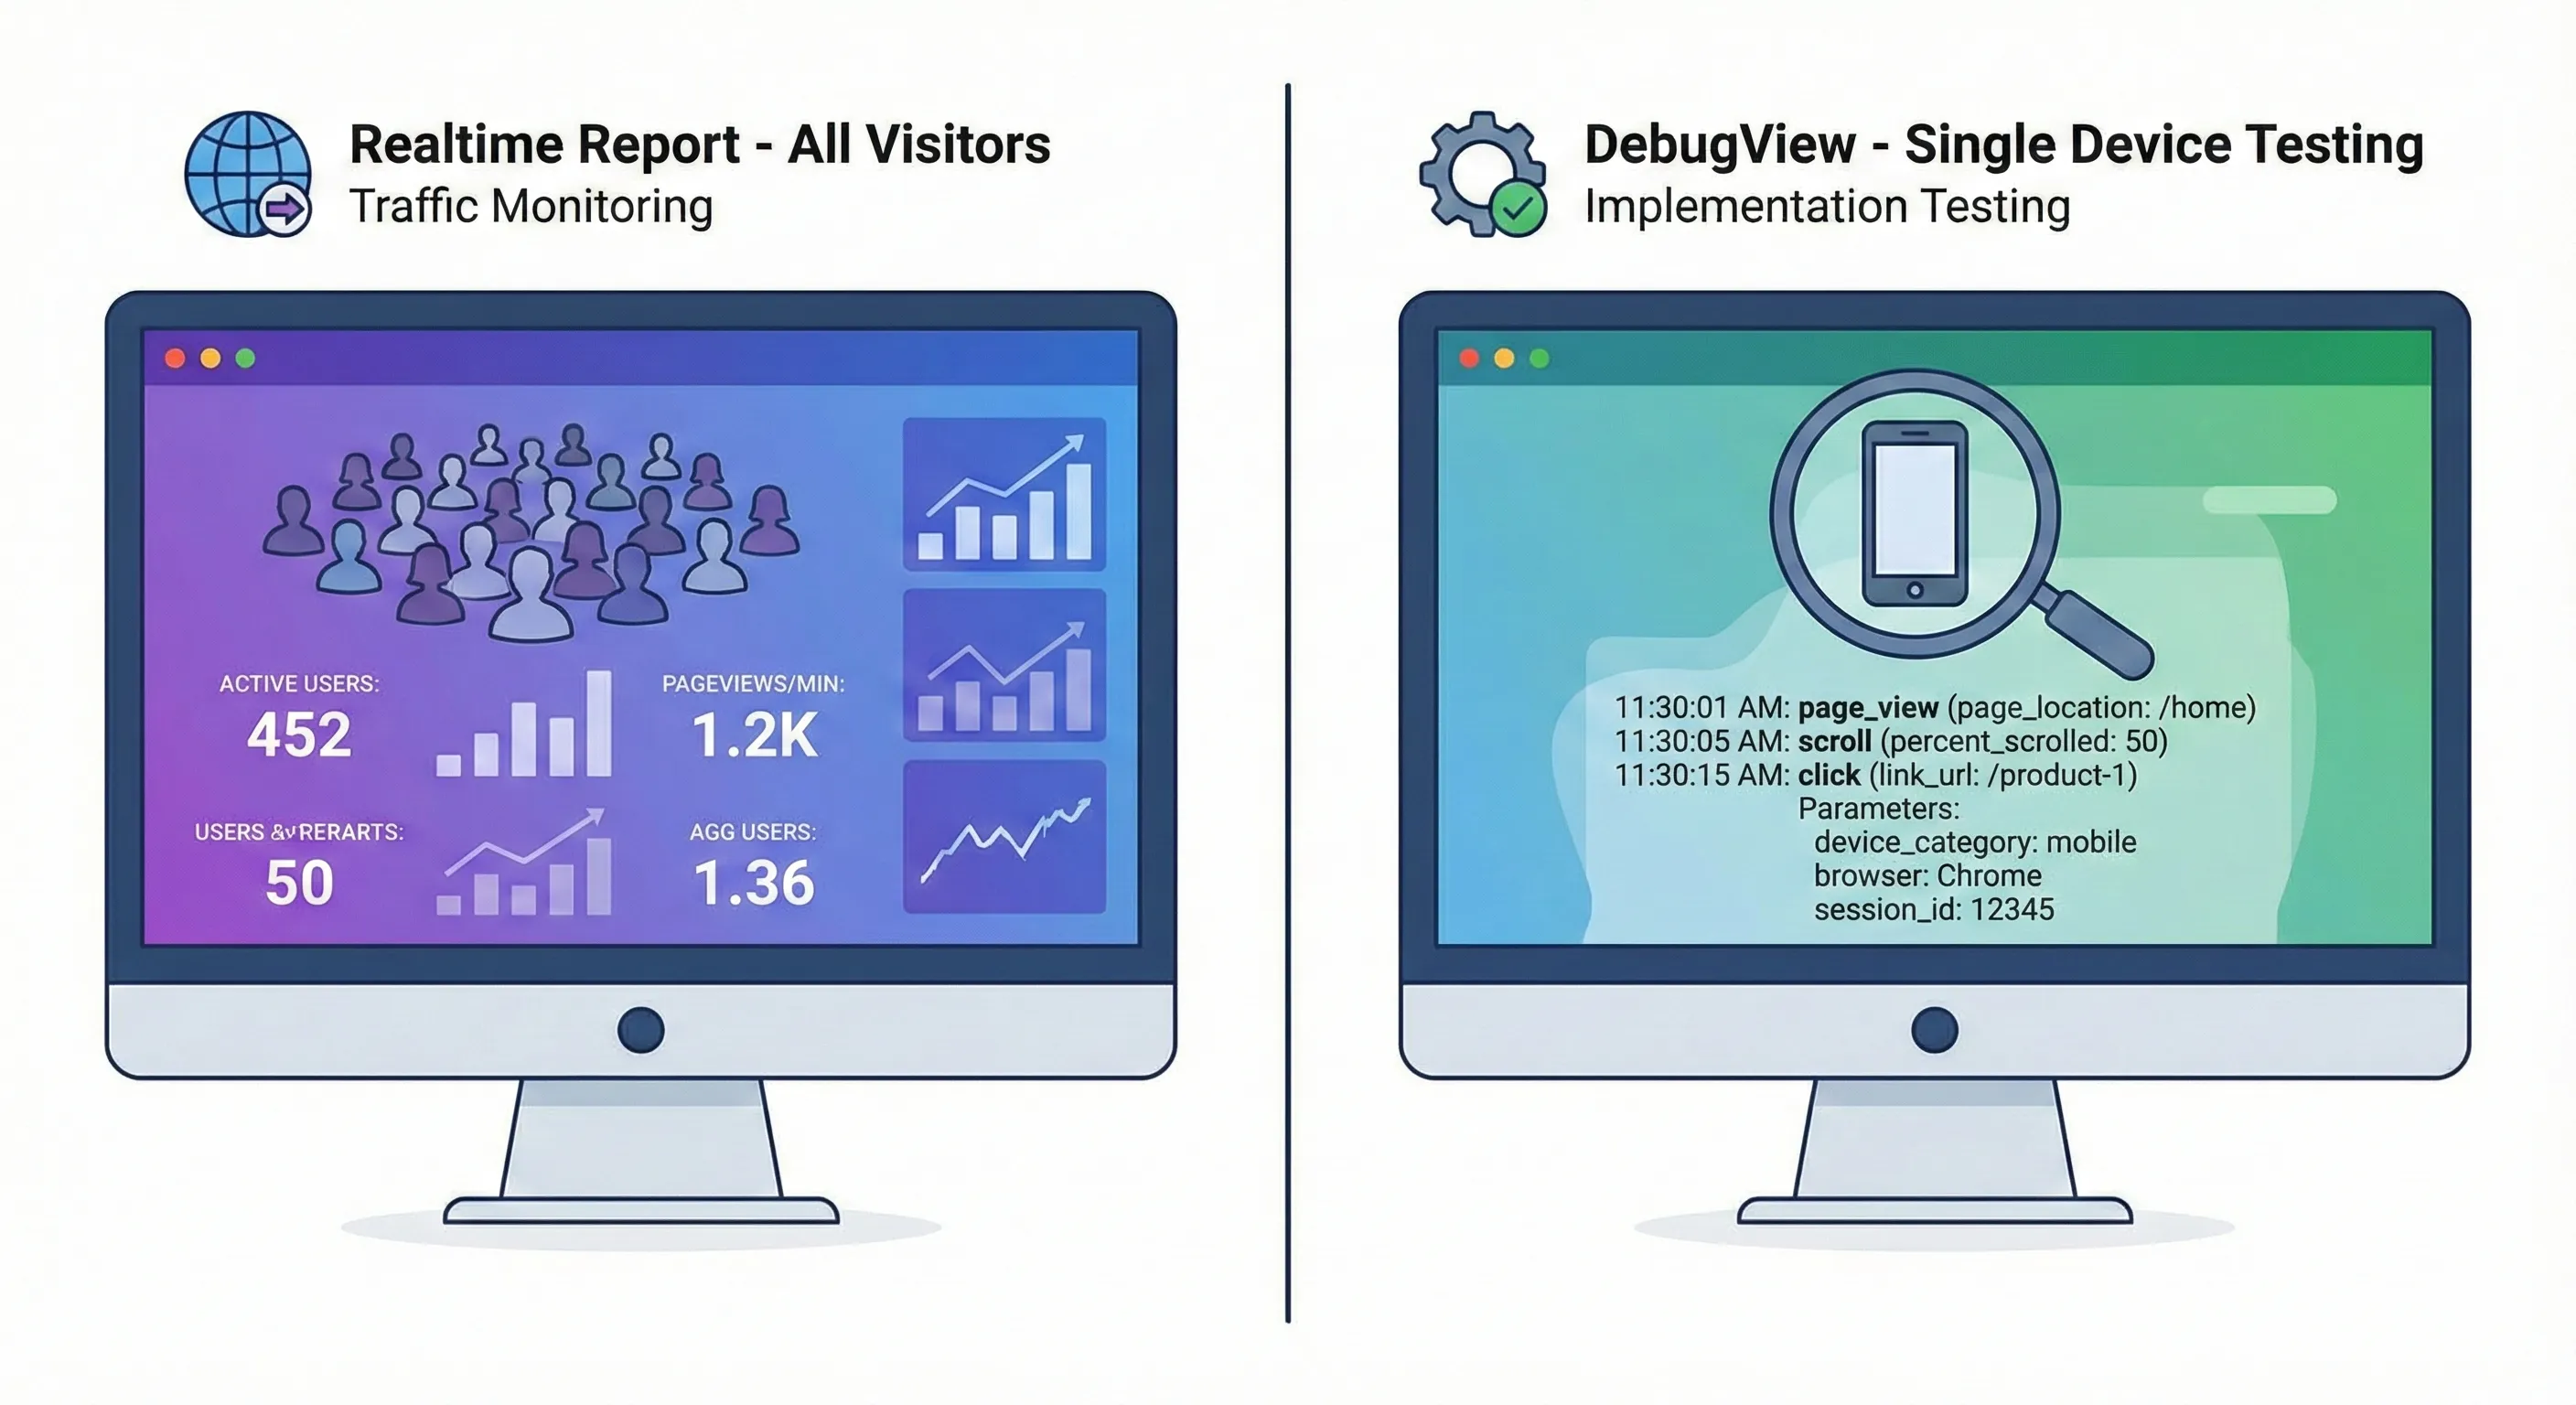
DebugView: Your Testing Environment
DebugView works completely differently. It isolates and shows you the data from one specific device (usually yours). When you activate debug mode on your browser or phone, DebugView displays every single event that device sends to GA4, along with all the parameters and properties attached to each event.
This isolation is what makes it perfect for testing. You can click a button on your site, then almost immediately see whether GA4 received the event and whether all the data you expected is actually there.
| Feature | Realtime Report | DebugView |
|---|---|---|
| Purpose | Monitor overall traffic | Test specific implementations |
| Data shown | All visitors combined | Single device only |
| Detail level | Aggregated metrics | Every parameter and property |
| Best for | Campaign monitoring | Implementation validation |
How Debug Mode Actually Works
DebugView doesn’t automatically show all traffic. You need to explicitly tell GA4 which device to monitor by activating debug mode.
When you enable debug mode, your tracking code adds a special flag to every event it sends. GA4 sees this flag and routes that data to DebugView instead of (or in addition to) standard processing.
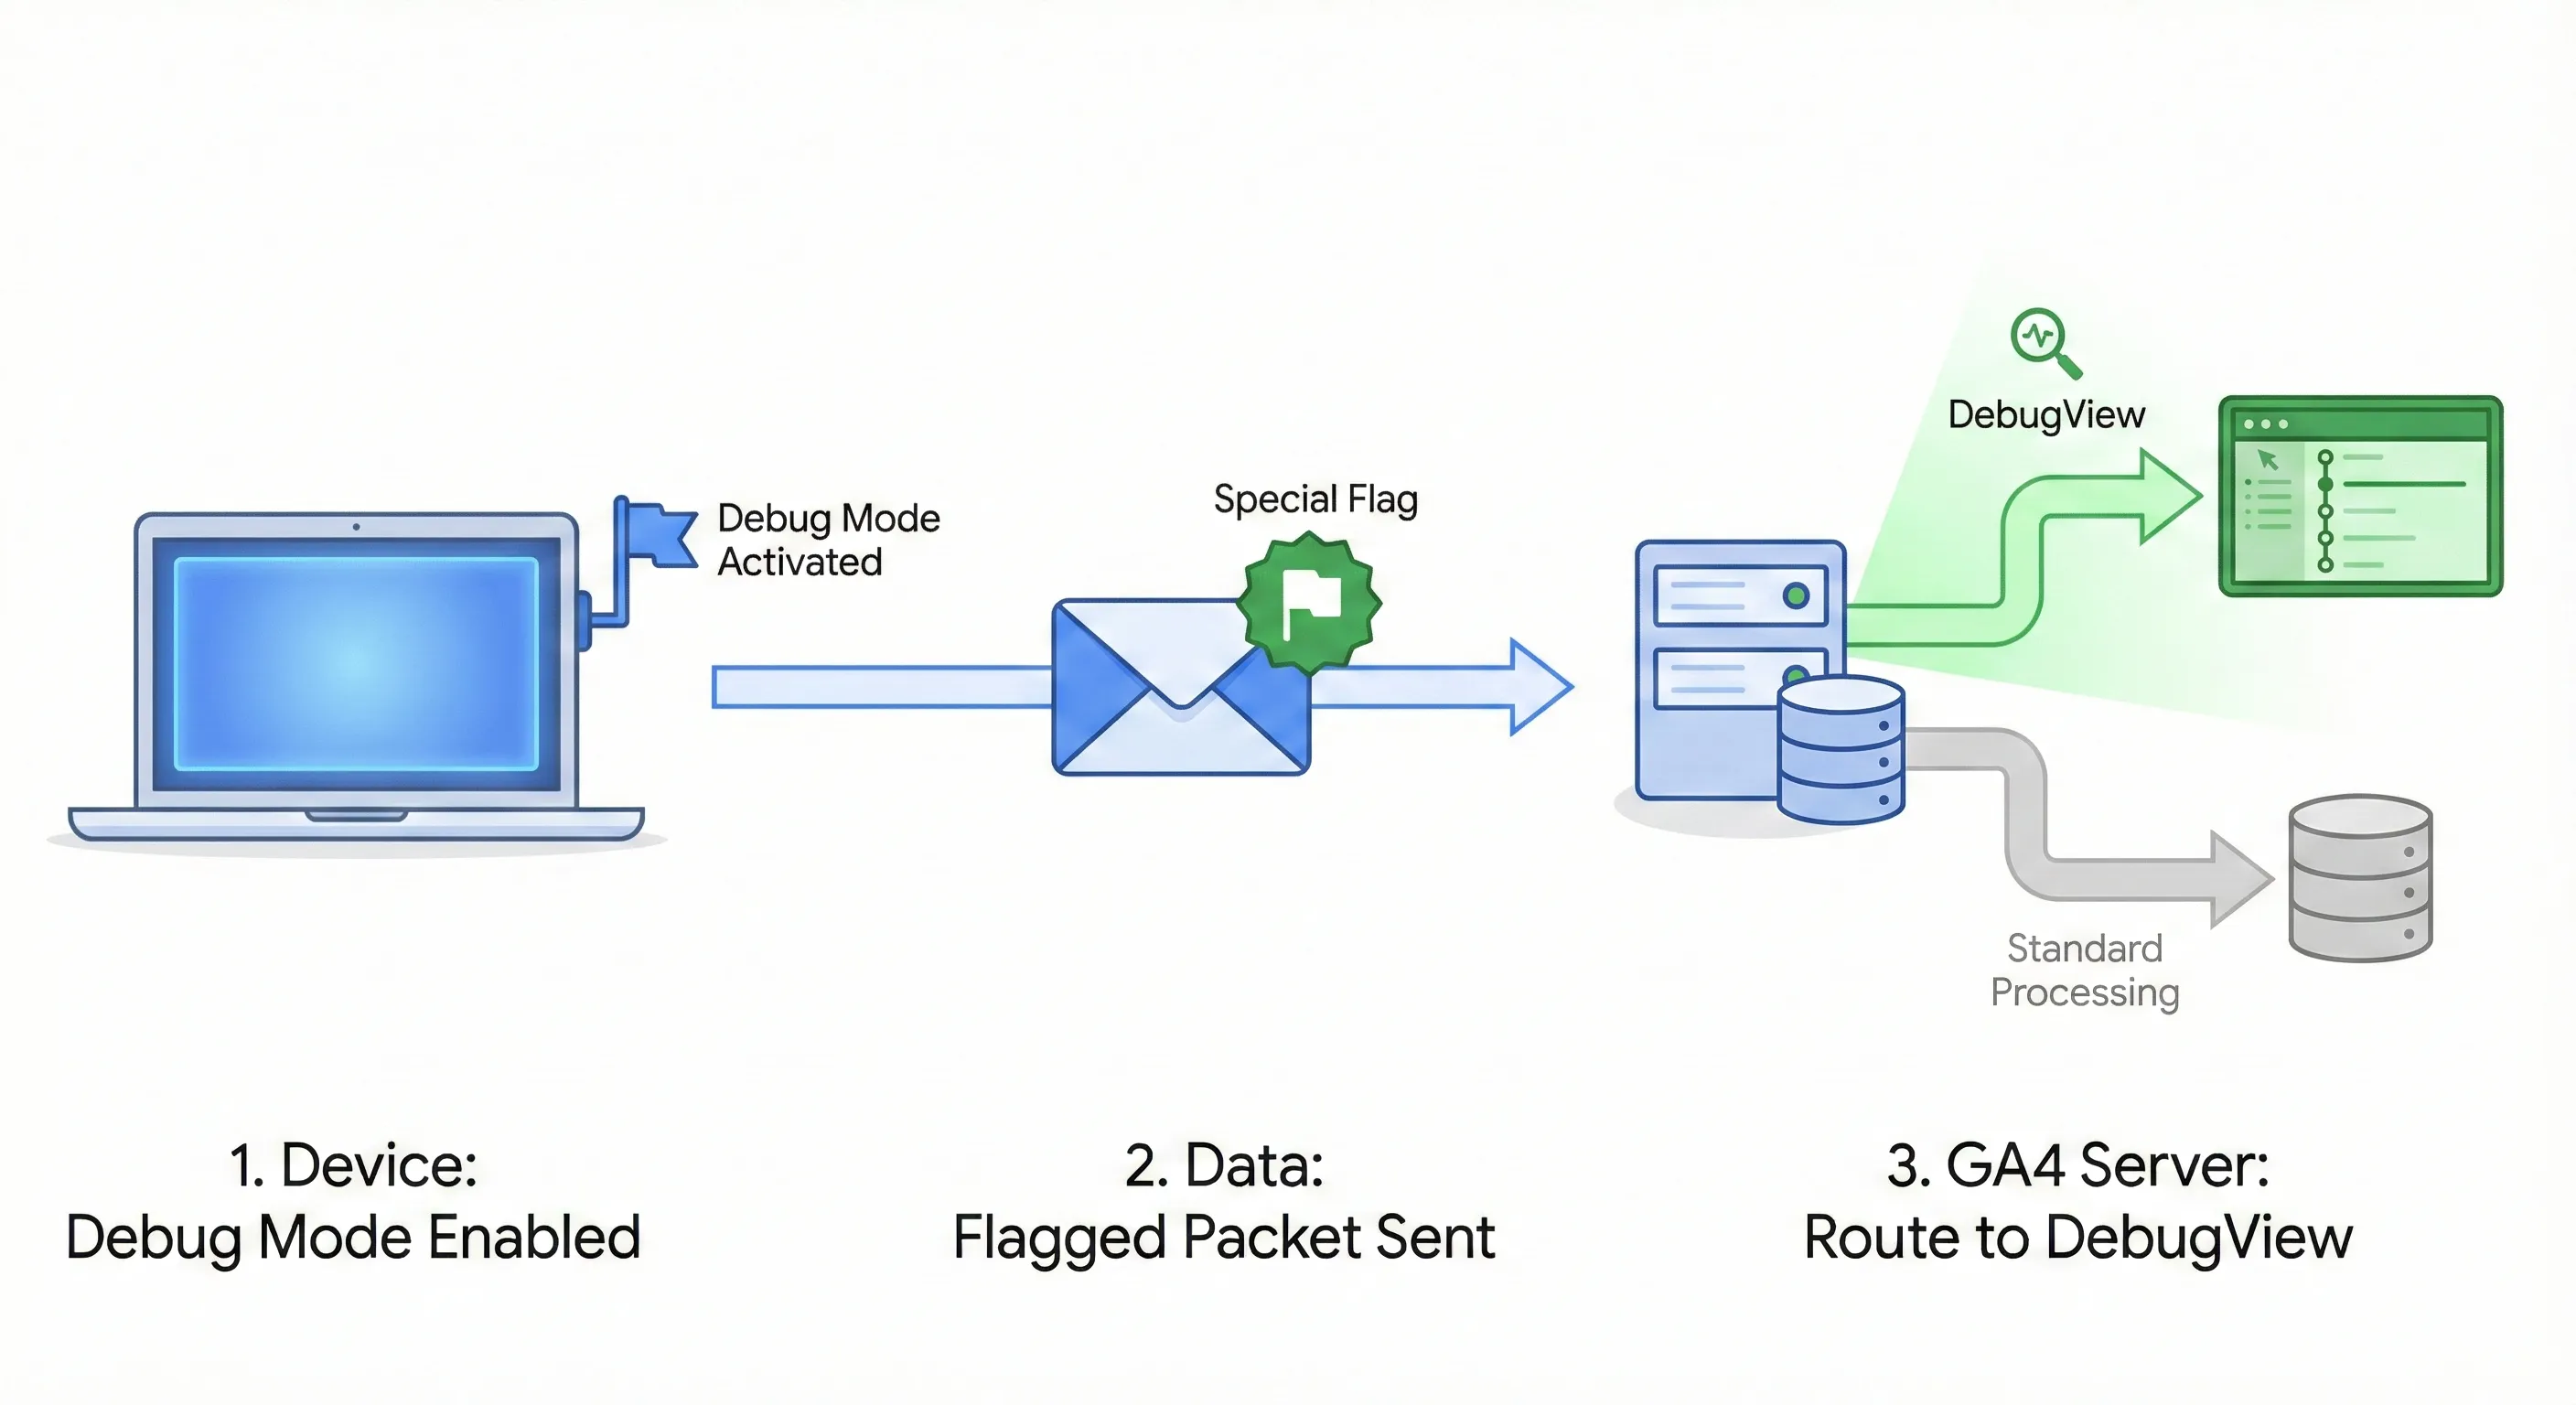
This flag-based system explains why the most common issue people face is “DebugView isn’t showing anything”. Usually, this means the flag isn’t being added correctly, not that the tracking itself is broken.
Setting Up GA4 DebugView for Websites
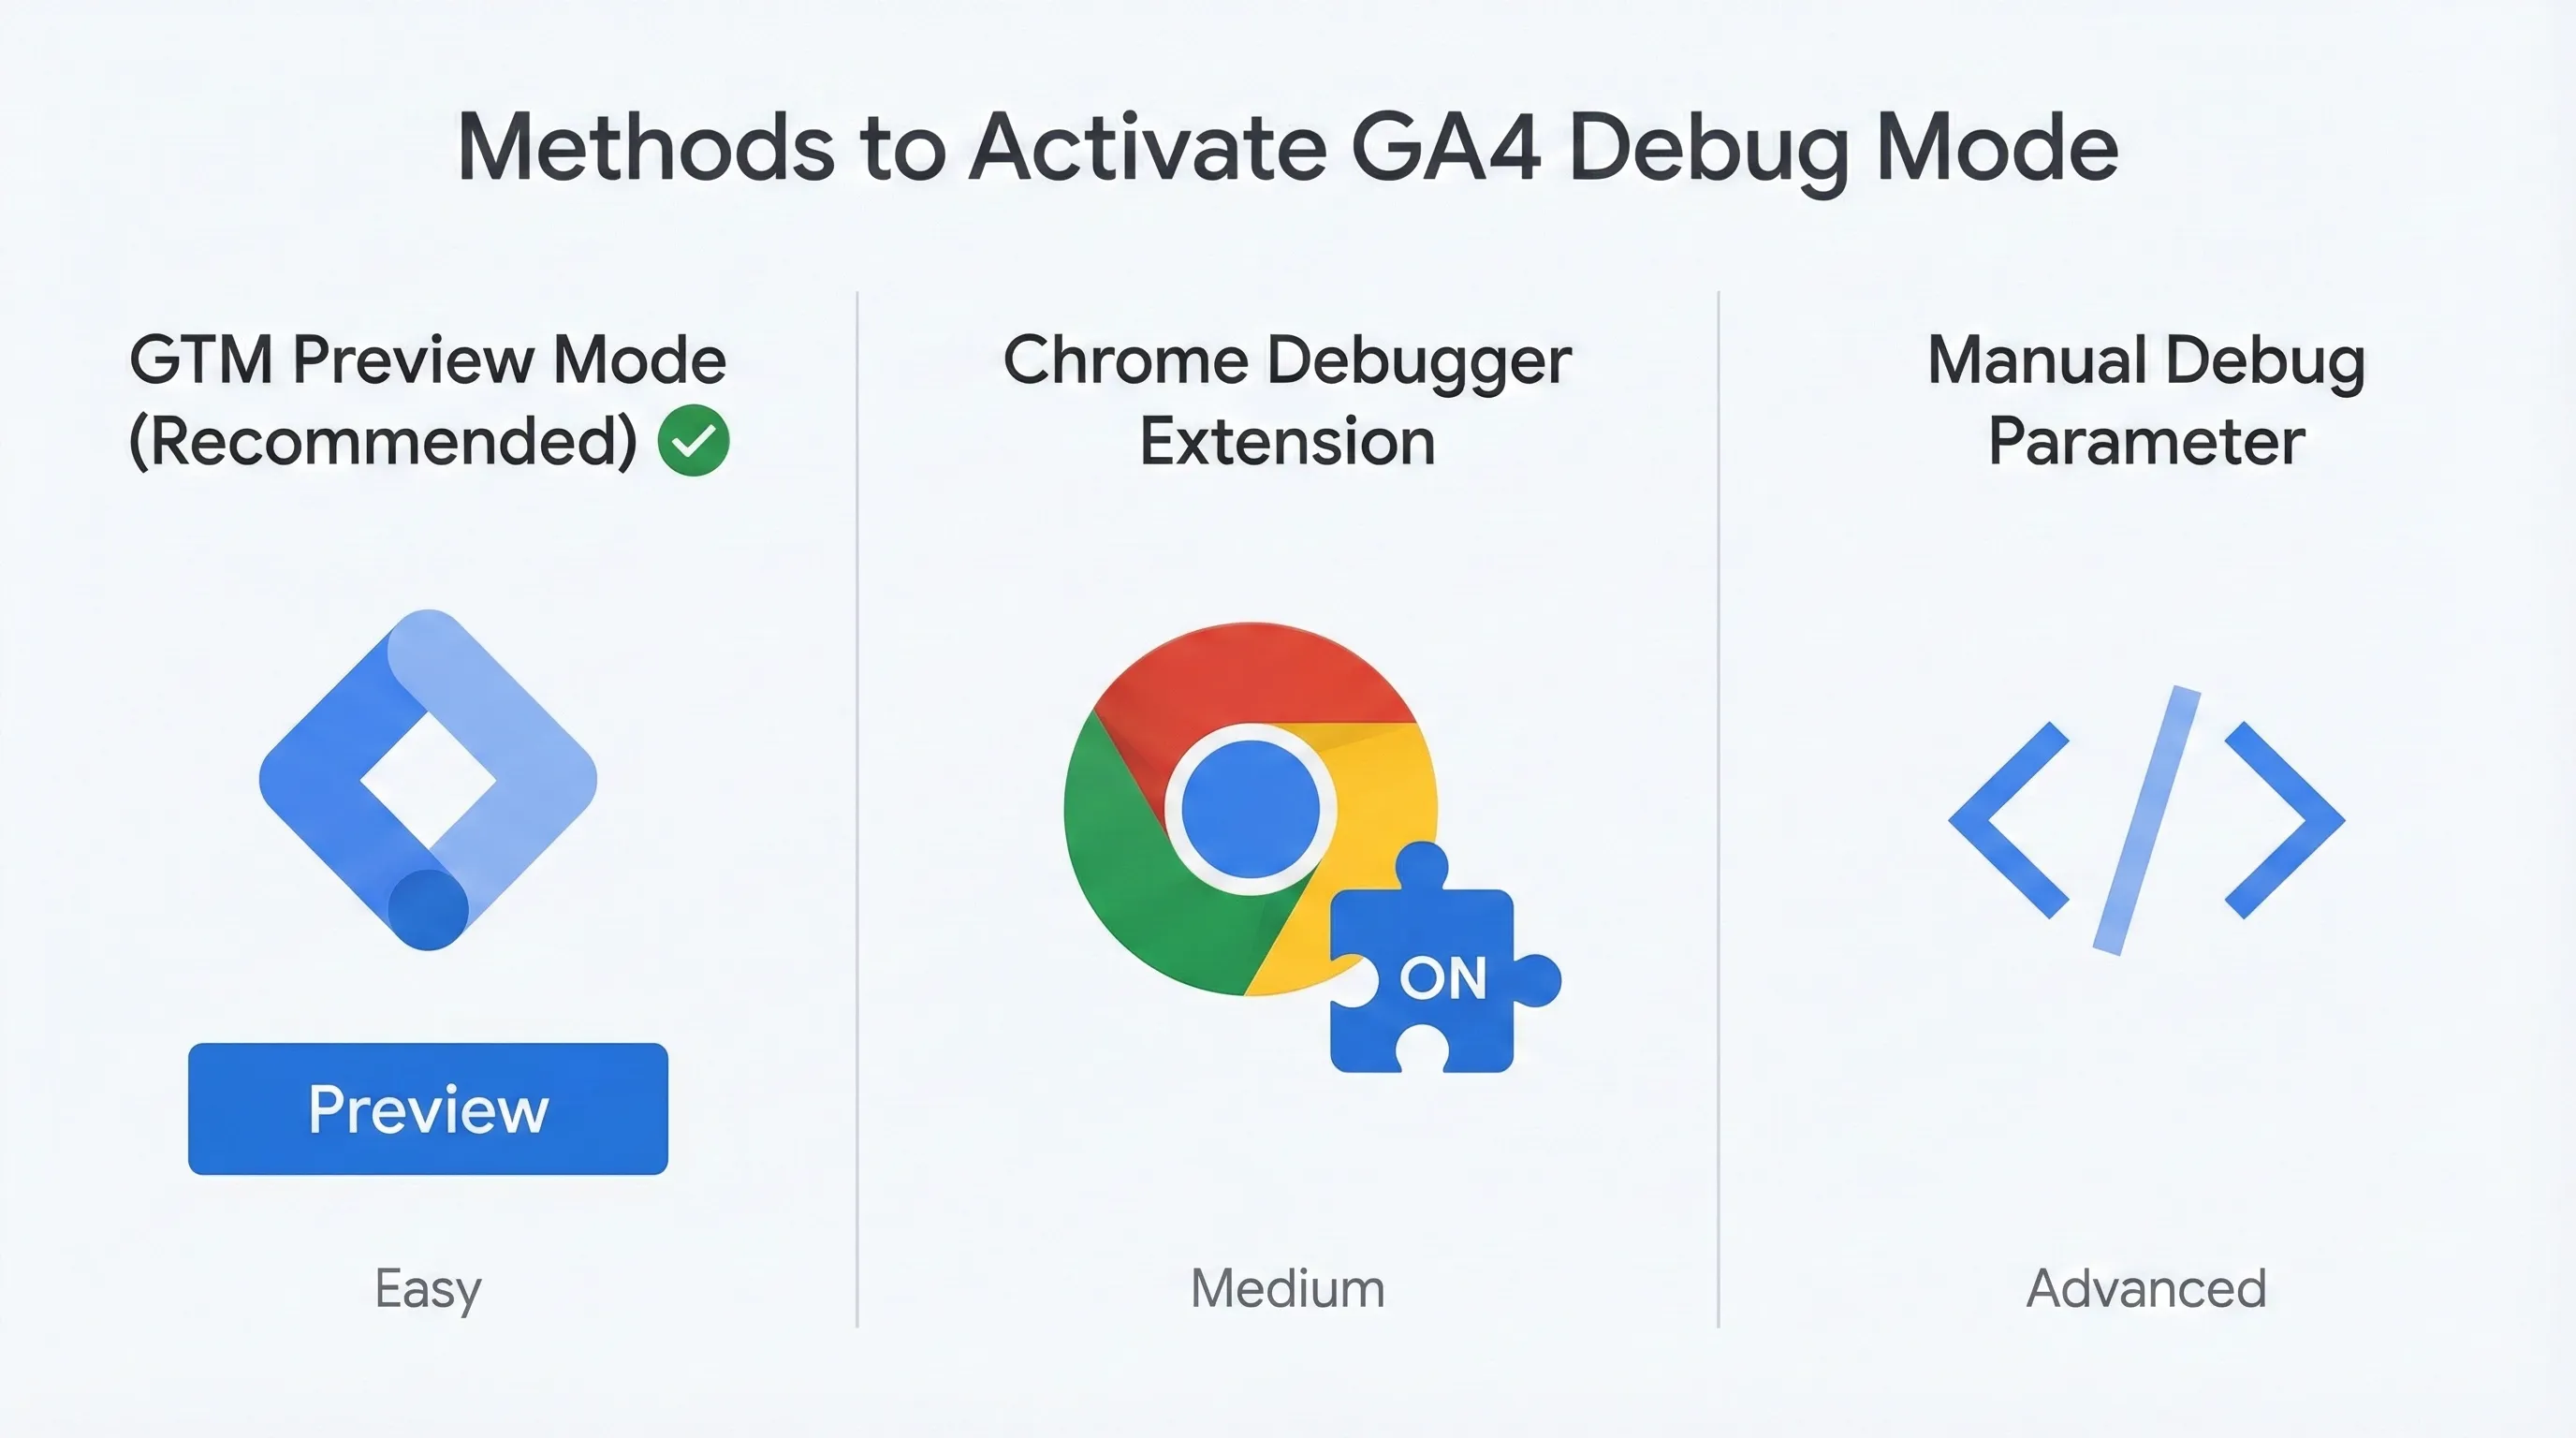
There are three ways to activate debug mode for website testing. Here’s a quick comparison to help you choose:
| Method | Best For | Pros | Cons |
|---|---|---|---|
| GTM Preview Mode | GTM users (recommended) | • Two debugging tools at once • Cleanest implementation • No risk to live site | • Requires GTM access |
| GA Debugger Extension | Quick tests without GTM | • No setup required • Works on any site • Easy to toggle | • Must remember to disable • Can affect other sites |
| debug_mode Parameter | Persistent debugging needs | • Always-on for dev environments • Works with server-side GTM | • High risk if published live • Requires code changes |
Method 1: Google Tag Manager Preview Mode (Recommended)
If you use Google Tag Manager, this is the easiest and most powerful option.
How to activate:
- Open your GTM workspace
- Click the
Previewbutton in the top right
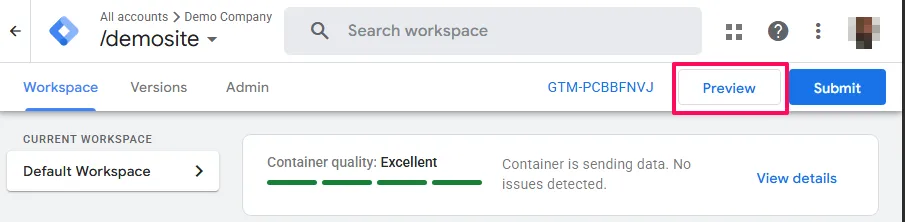
- Enter your website URL and click
Connect
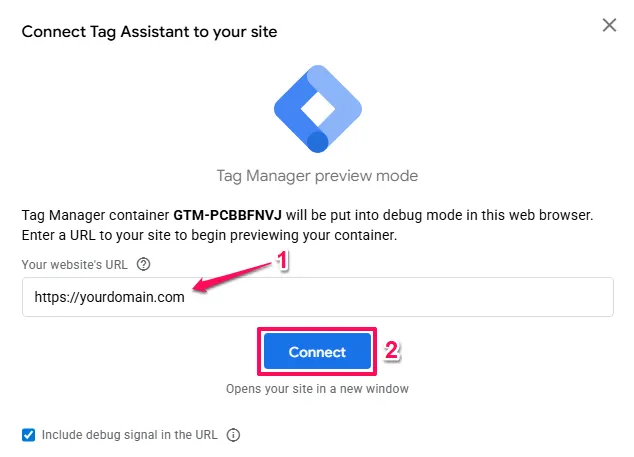
- A new tab opens with your site in debug mode
Why this method is best:
When you use GTM Preview mode, you get two debugging tools at once. The Tag Assistant window shows you which tags fired and why, whilst DebugView shows you what data GA4 actually received. This combination helps you troubleshoot issues much faster.
The debug mode only affects your browser session. Other visitors to your site won’t be impacted, and their data won’t appear in your DebugView.
Method 2: Google Analytics Debugger Extension
If you don’t have access to Google Tag Manager, or if you need to quickly test someone else’s website, use the Google Analytics Debugger Chrome extension.
How to activate:

- Click the extension icon to turn it “ON” (you’ll see an ON badge)

- Refresh your website
- Open DebugView in GA4
Important: Remember to turn this extension off when you’re finished testing. If you leave it on, every website you visit that uses GA4 will send debug data, which could confuse you later or pollute other properties you have access to.
Method 3: Manual Debug Mode Parameter
This method involves adding code to your tracking setup. Only use this if you’re comfortable with code or if the other methods aren’t available.
For gtag.js implementations:
Add 'debug_mode': true to your config command:
gtag('config', 'G-XXXXXXXXXX', {
  'debug_mode': true
});For Google Tag Manager:
Add a parameter called debug_mode with a value of true to your GA4 Configuration tag or individual event tags.
Critical warning: This method modifies your actual tracking code. If you accidentally publish this change to your live site, every single visitor will be flagged as a debug user. This will flood DebugView with everyone’s data, making it useless for testing, and could exclude all your traffic from standard reports if you have certain filters active.
Only use this method in development environments or with proper safeguards (like checking the user’s IP address first).
Setting Up GA4 DebugView for Mobile Apps
Mobile apps require a different approach because they’re designed to conserve battery and data. By default, your app collects events but only uploads them periodically (often every hour or when the device connects to Wi-Fi).
To use DebugView, you need to force the app to upload events immediately.
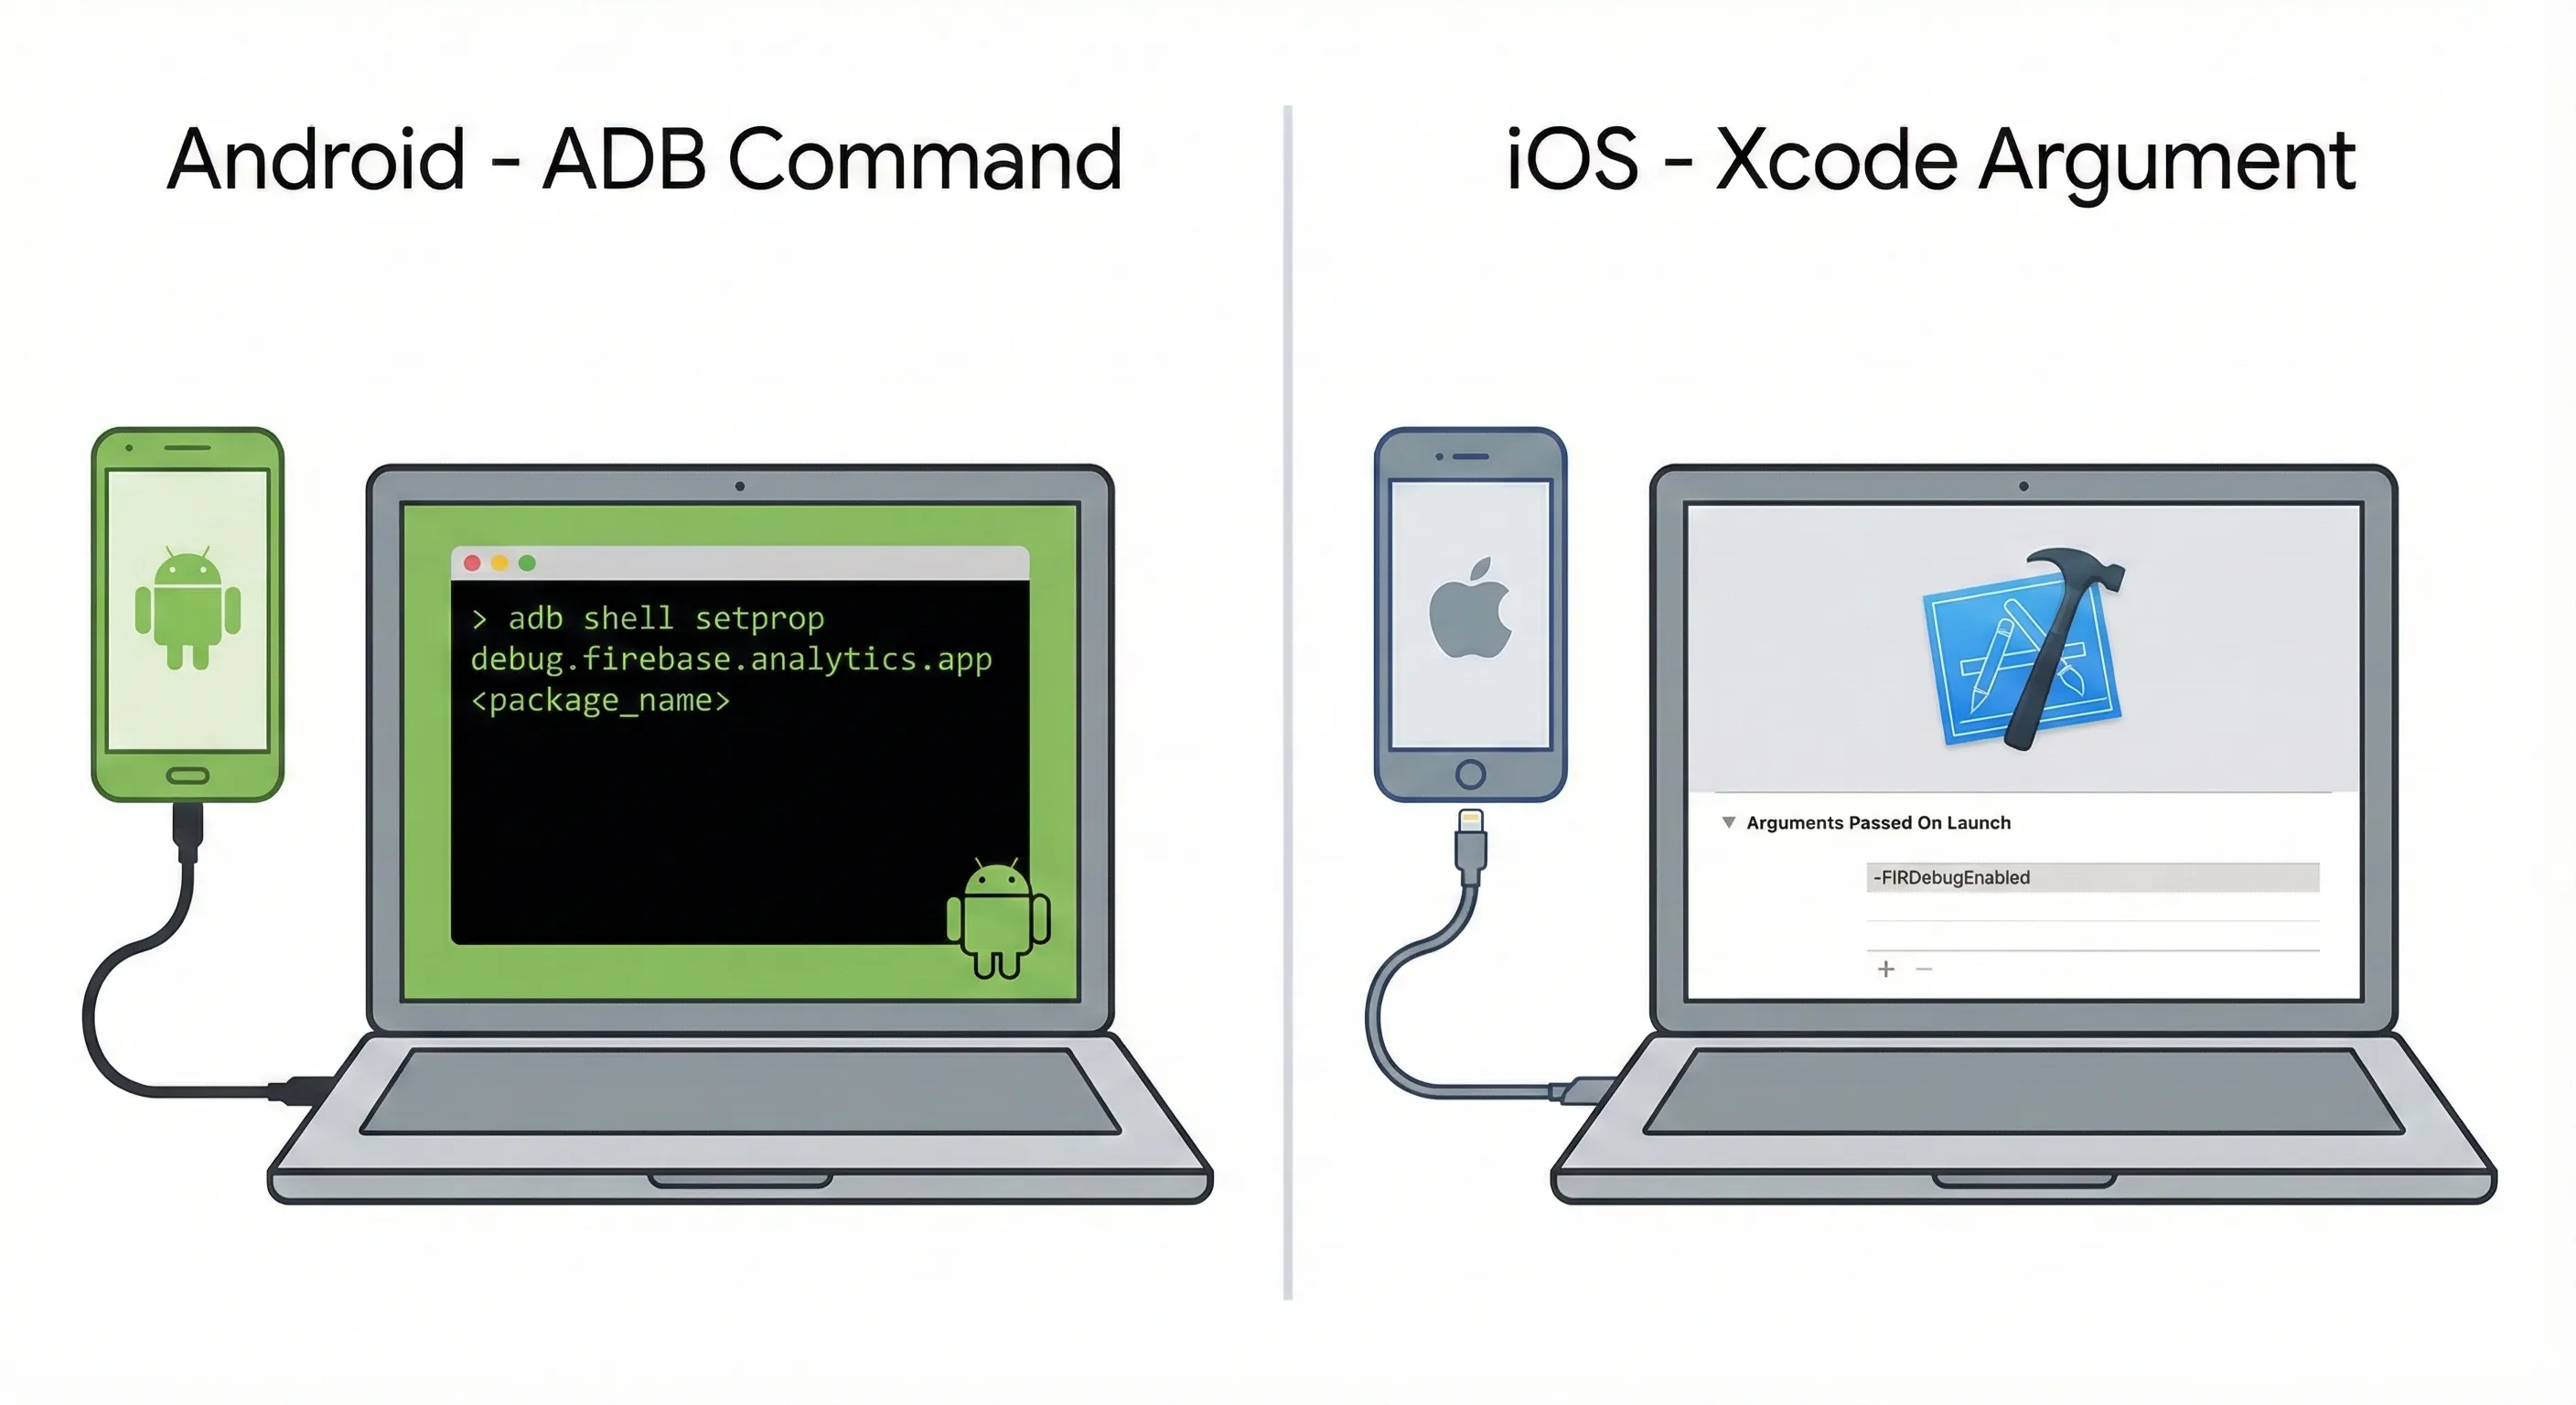
Android Setup
For Android apps, you’ll use the Android Debug Bridge (ADB) to enable debug mode on your test device.
The command:
adb shell setprop debug.firebase.analytics.app <package_name>Replace <package_name> with your app’s package name (like com.yourcompany.yourapp).
Important details:
- This setting persists even if you disconnect your device. If you test today, disconnect, then test again tomorrow, debug mode will still be active.
- To turn it off, run:
adb shell setprop debug.firebase.analytics.app .none - If your app has multiple versions (like a development version and a production version), make sure the package name matches the specific version you’re testing.
iOS Setup
For iOS apps, you’ll add a launch argument in Xcode.
The argument:
-FIRDebugEnabledHow to add it:
- Open your project in Xcode
- Select your scheme from the scheme selector
- Click
Edit Scheme - Go to the
Runsection - Click the
Argumentstab - Under
Arguments Passed On Launch, click the+button - Add
-FIRDebugEnabled
TestFlight limitation: This argument only works when running the app directly from Xcode. If you distribute your app through TestFlight, the debug flag won’t be active. QA teams testing TestFlight builds won’t be able to use DebugView unless you’ve programmed a way to enable debug mode from within the app itself.
To turn off debug mode, change the argument to -FIRDebugDisabled.
Understanding the DebugView Interface
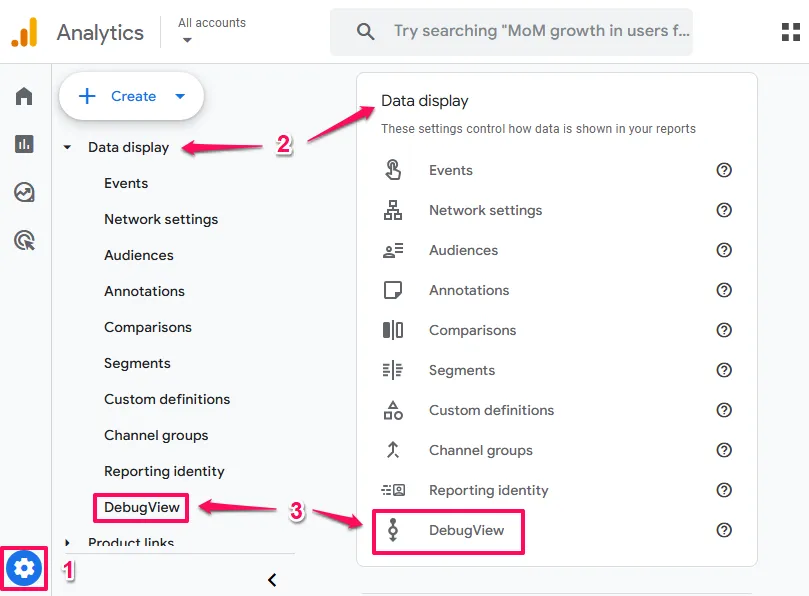
Once you’ve activated debug mode and opened DebugView (Admin > Data display > DebugView), you’ll see an interface divided into several sections. Each section gives you different insights into your data stream.
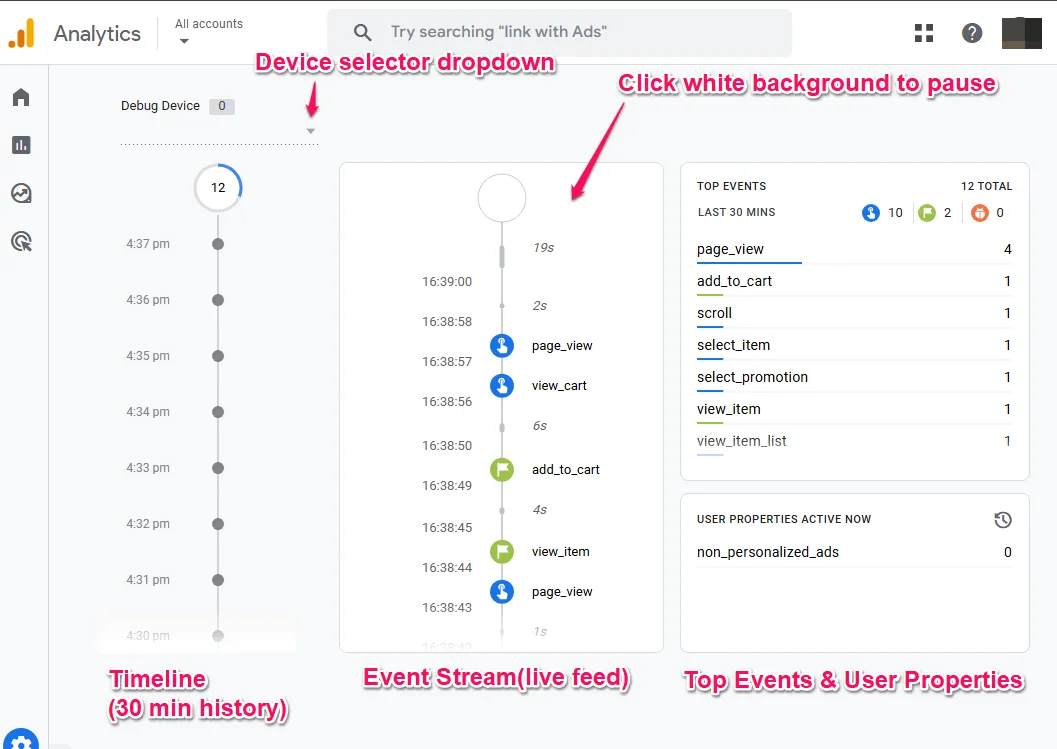
The Timeline (Left Side)
The left side shows the last 30 minutes as a vertical timeline. Each circle represents one minute, and the number inside shows how many events were sent during that minute.
The Event Stream (Centre)
The centre column is where you’ll spend most of your time. It shows every event as it happens, with the newest events appearing at the top.
How to use it:
Click any event to expand it and see all the parameters it contains. This is where you verify whether your tracking is working correctly. For example, if you’re tracking a button click, expand the event and check whether the button name, page location, and any custom parameters are present and correct.
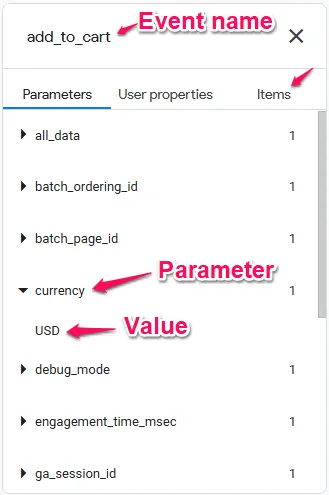
Pause the stream: If events are coming in too fast to read, click anywhere on the white background of this column to pause the feed. This freezes the display so you can review events at your own pace.
Event Colours and Icons
GA4 uses colours to help you quickly identify different types of events:
- Blue icons: Standard events like
page_view,scroll, or custom events you’ve created - Green icons: Events marked as Key Events (previously called Conversions) in your GA4 settings
- Orange icons: User property updates (like when someone logs in or when you set a custom user property)
- Orange bug icons: Errors or malformed events that GA4 couldn’t process correctly
If you’ve set up a purchase as a Key Event but it appears with a blue icon instead of green, that’s a warning sign. It means the event is firing, but GA4 doesn’t recognise it as a Key Event. You’ll need to check your Key Events configuration.
Top Events and User Properties (Right Side)
The right column shows two things:
Top Events: A count of how many times each event name has fired in the last 30 minutes. This helps you spot problems quickly. If you see an event firing hundreds or thousands of times unexpectedly, you’ve probably got a tracking loop or misconfigured trigger.
User Properties: The current state of all user properties for the device you’re monitoring. This updates in real-time as properties change. For example, if a user logs in and you’re setting a logged_in_status property, you should see it change from false to true here immediately.
The Device Selector
The dropdown in the top left lets you choose which device to monitor. This matters when multiple people on your team are testing simultaneously.
For websites, devices are often labelled generically (like “Google” or “Apple”), which can be confusing if multiple team members are testing at once. Check the timestamps on recent events to confirm which device is actually yours.
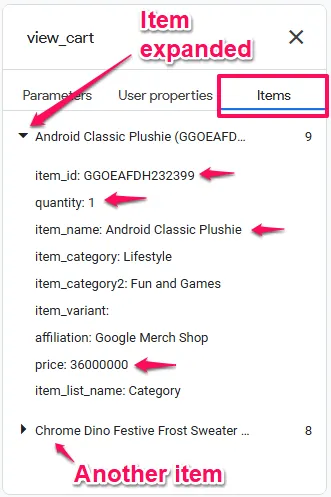
Testing Ecommerce Tracking
Ecommerce tracking is one of the most common areas where implementations fail. The requirements are strict, and a single mistake can prevent revenue data from appearing in your reports.
What to Check in DebugView
When you’re testing purchase or add-to-cart events, DebugView provides a special Items tab within the event details. This is where you verify your product information.
Critical checks:
- The Items tab exists: If you expand a purchase event and there’s no Items tab, your items data isn’t being sent at all.
- Items array is populated: Click the Items tab and verify you can see your products listed.
- Required fields are present: Each item must have at least an
item_idanditem_name. - Values are correct: Check that prices, quantities, and currencies match what you expect.
Common Ecommerce Failures
Problem: The purchase event fires but the Items tab is empty or missing.
Cause: Usually, this means your items data is formatted incorrectly. The most common mistake is passing items as a string instead of an array of objects.
How to verify: Look at your dataLayer or the variables in GTM. Items should look like this:
items: [
  {
    item_id: "SKU_12345",
    item_name: "Blue Widget",
    price: 19.99,
    quantity: 1
  }
]Not like this:
items: "SKU_12345" <em>// Wrong - this is a string, not an array</em>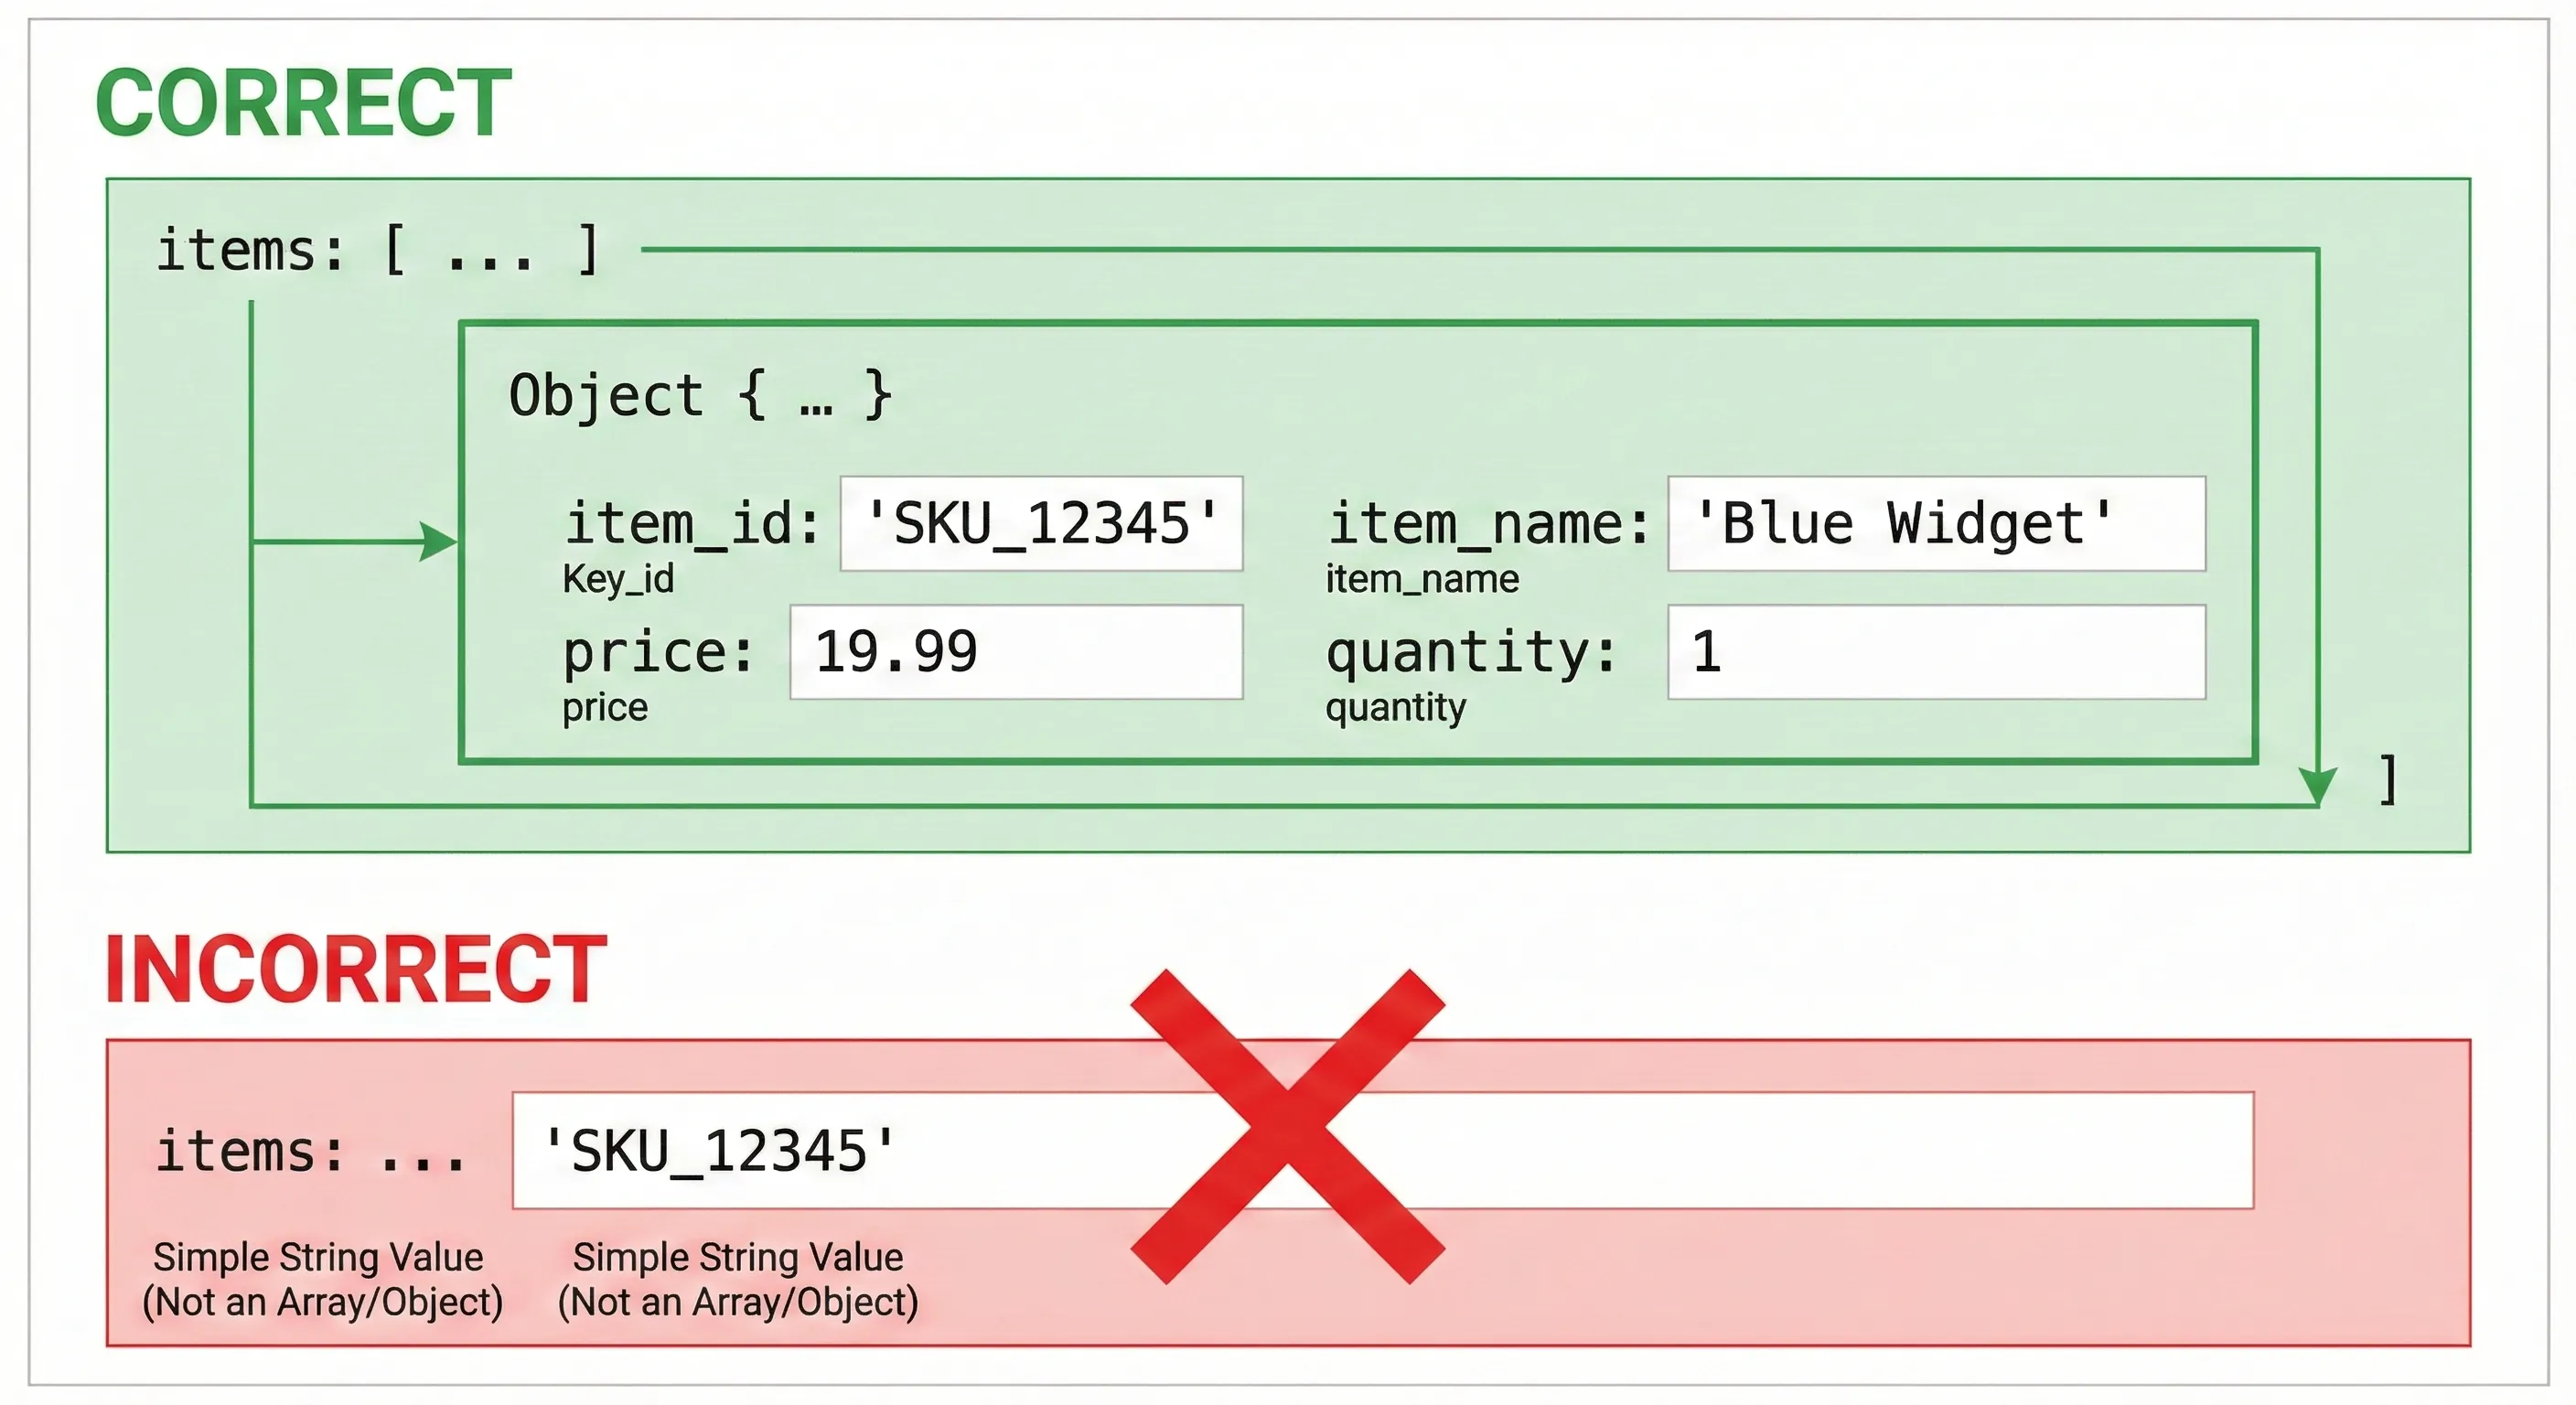
Problem: Subsequent page views show ecommerce parameters they shouldn’t have.
Cause: You didn’t clear the ecommerce object from your dataLayer after the purchase event fired. This causes the purchase data to “leak” into other events.
Solution: After sending the purchase event, reset your ecommerce object:
dataLayer.push({
  ecommerce: null
});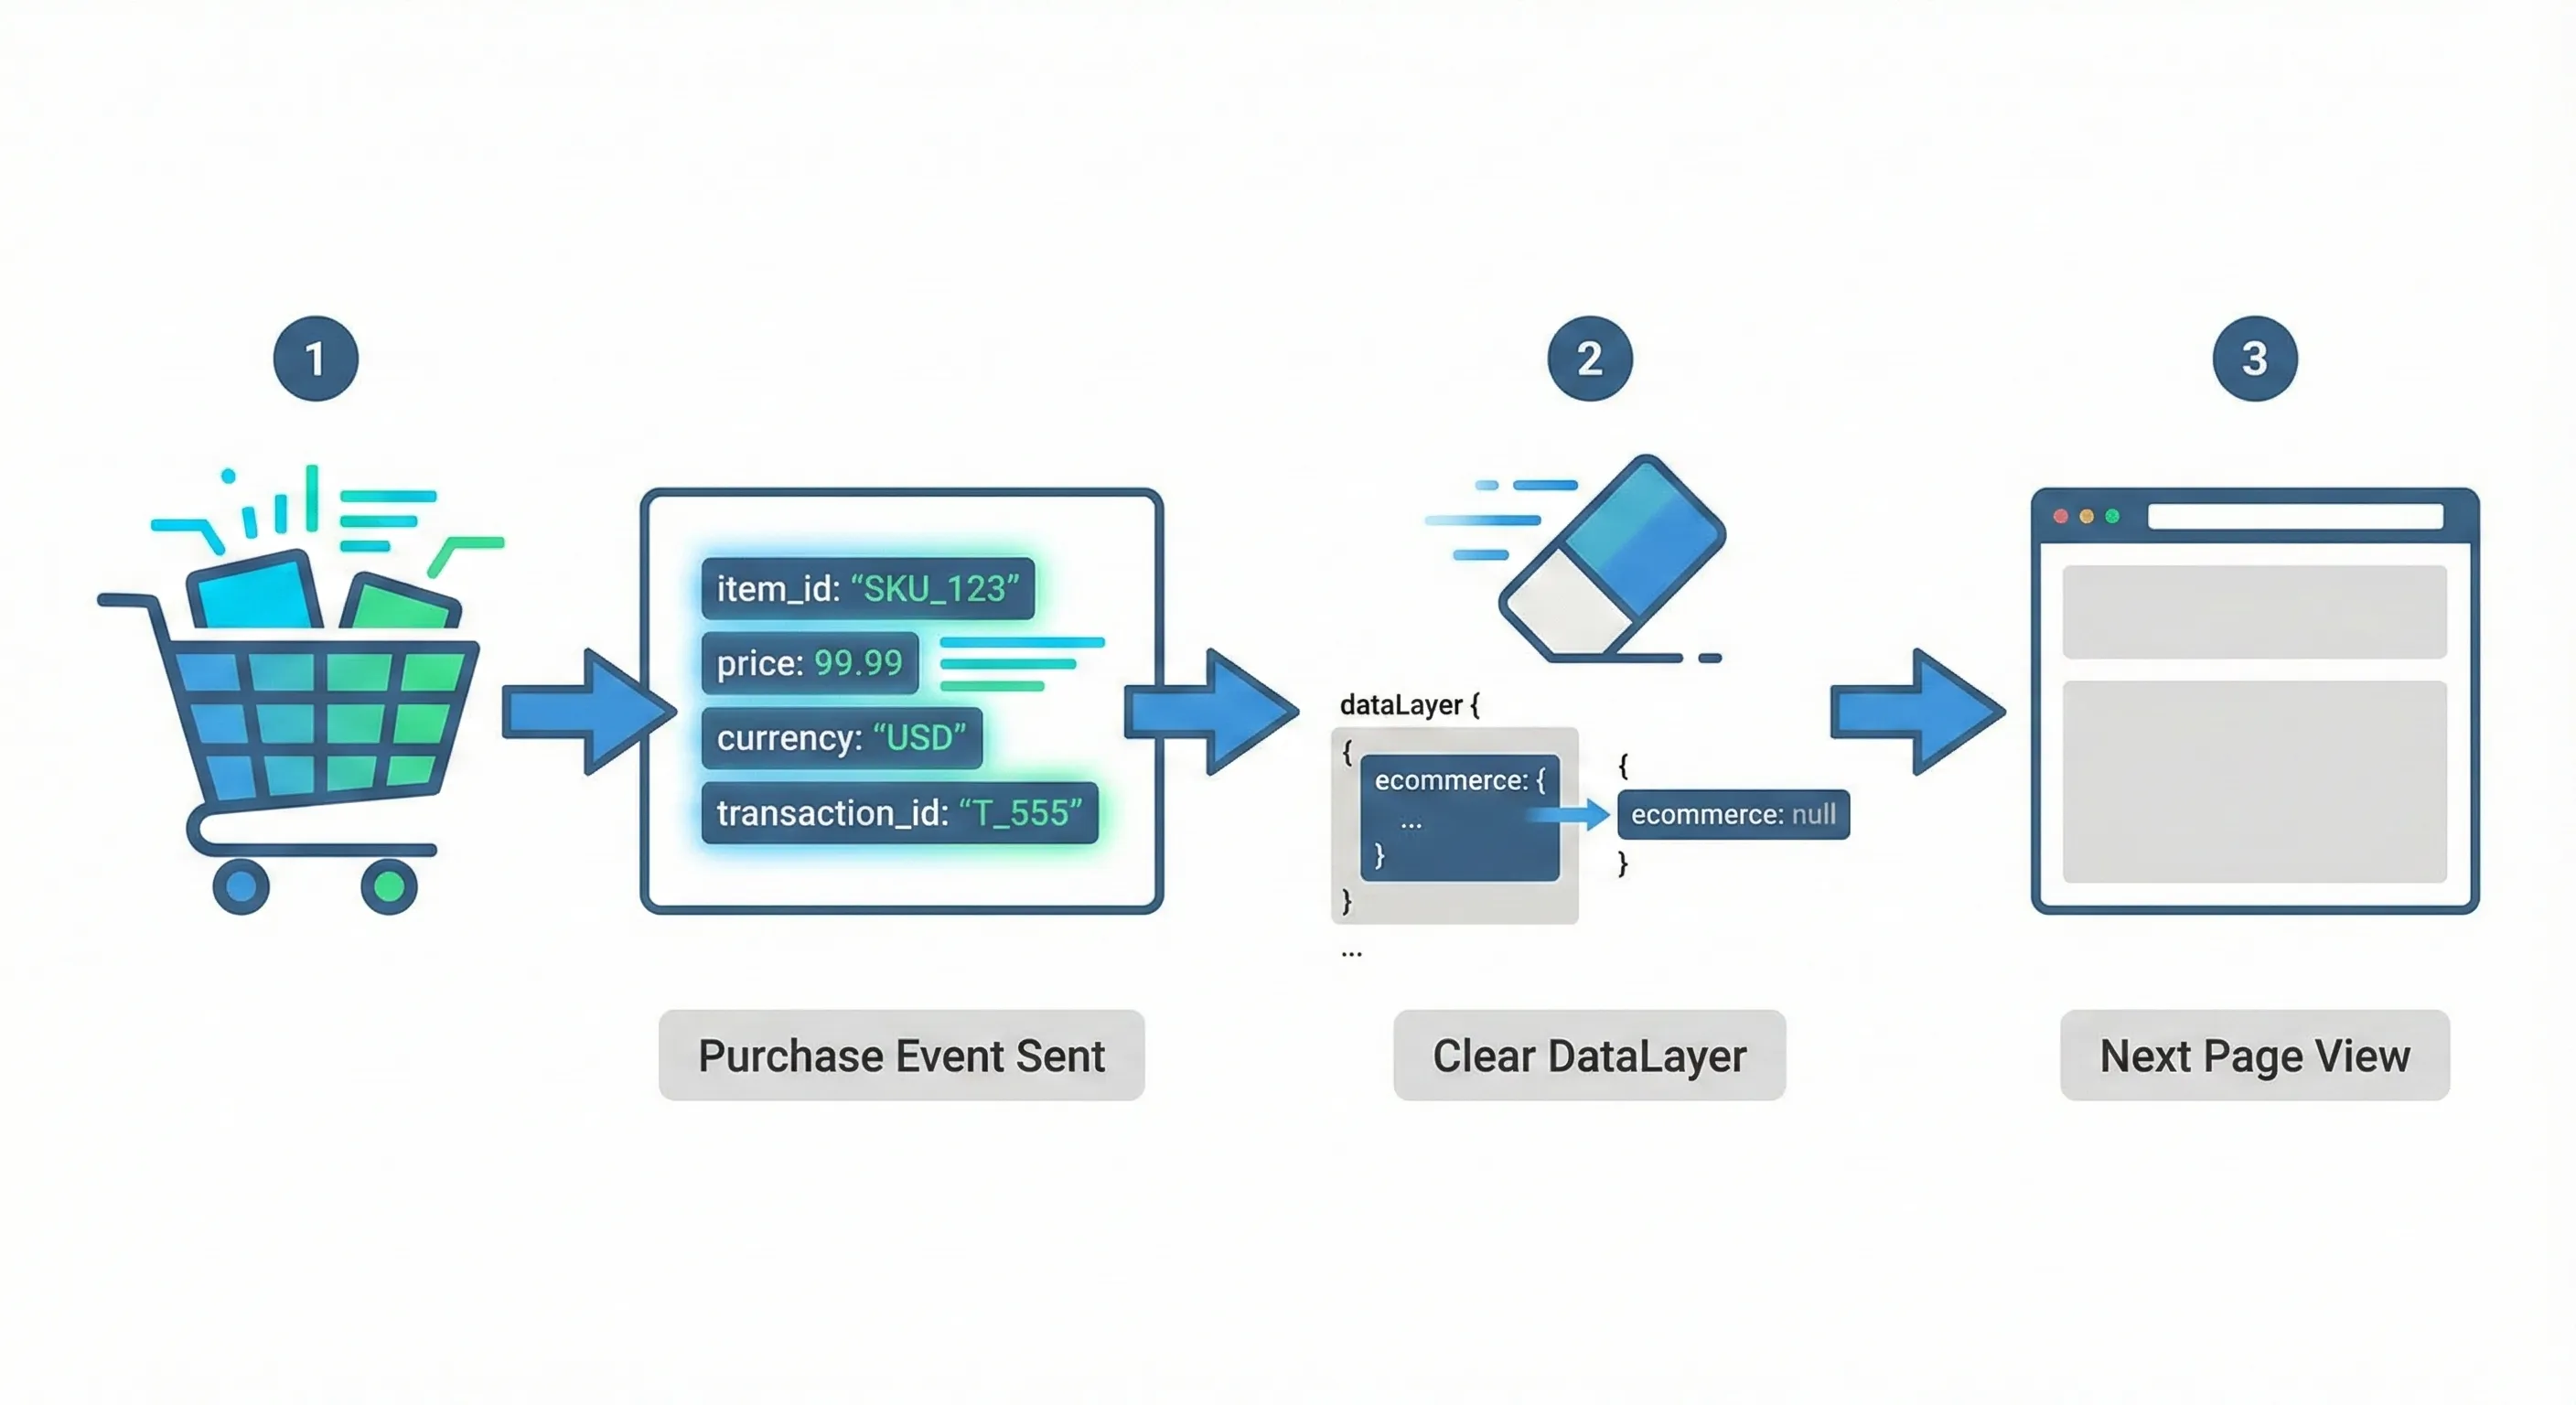
DebugView will show you if this is happening. If you see a page_view event with unexpected ecommerce parameters, you haven’t cleared your dataLayer properly.
Troubleshooting Common GA4 DebugView Issues
Issue: “No Devices Available” Message
This is the most frustrating DebugView problem because your tracking might be working perfectly, but you can’t see it.
Common causes:
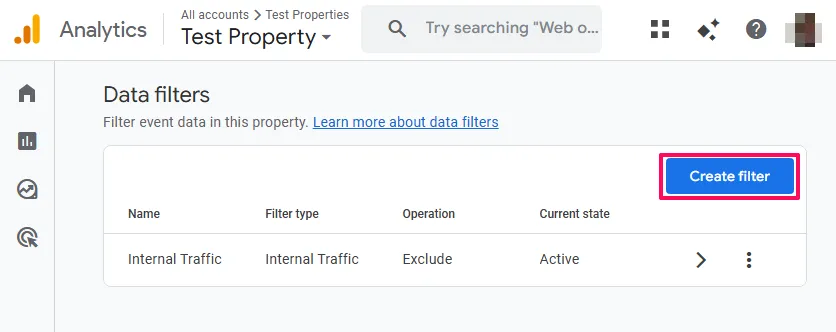
1. Internal Traffic Filter conflict
Many businesses set up filters to exclude their office IP address from reports. If you’ve set this filter to “Active”, it might be blocking your debug data before it reaches DebugView.
Solution: Go to Admin > Data Filters and temporarily set your Internal Traffic filter to “Testing” instead of “Active”. In Testing mode, your data still flows through but gets labelled, so you can see it in DebugView whilst keeping it separate from production data.
2. Ad blockers and browser extensions
Ad blockers like uBlock Origin often block Google Analytics entirely. If the tracking request never leaves your browser, GA4 never receives it, so DebugView has nothing to show.
Solution: Temporarily disable ad blockers on your test site. If you use Brave browser, you’ll need to turn off Shields for your domain.
3. The “0 devices” display bug
Sometimes DebugView shows “0 devices” in the dropdown even though devices are actually connected. This is a known interface quirk.
Solution: Click the dropdown anyway. The device list often populates when you interact with it, despite the zero count display.
Issue: Events Show in GTM Preview but Not in DebugView
If you can see your tag firing in Google Tag Manager’s preview mode but the event isn’t appearing in GA4 DebugView, the problem is in how the data is being sent to GA4, not in the trigger itself.
Common causes:
- Measurement ID is incorrect: Double-check that your GA4 Configuration tag is using the correct
G-XXXXXXXXXXMeasurement ID. - Event parameters are malformed: GA4 might be rejecting the event entirely if required parameters are in the wrong format.
- Tag is blocked by consent settings: If you’ve implemented consent mode, check whether consent has been granted.
How to diagnose: Use your browser’s Network tab (in Developer Tools) to inspect the actual HTTP request going to google-analytics.com. If you see the request there but not in DebugView, the problem is on GA4’s side, which usually means malformed data.
Issue: Seeing Data from All Users, Not Just Your Test Device
This suggests debug mode is active for your entire site, not just your test session.
Cause: You’ve likely published the debug_mode: true parameter to your live site instead of keeping it restricted to your development environment.
Solution: Immediately remove the debug_mode parameter from your live site. Check your GTM container and published tags, or review any recent code changes to your tracking implementation.
Prevention: Never use Method 3 (manual debug_mode parameter) on production environments. Stick to GTM Preview mode or the Chrome extension for testing live sites.
Server-Side Tracking and GA4 DebugView
If you’ve implemented server-side Google Tag Manager, DebugView works differently because your data takes an extra step through your server before reaching GA4.
The debug flag needs to survive this journey: from your browser → to your server container → to GA4.
How it works: When you use GTM Preview mode on a server-side setup, the standard GA4 Client in your server container automatically recognises and forwards the debug flag to GA4.
If it’s not working: The issue is usually that the server-side GA4 tag isn’t configured to pass the debug parameter through. Check your server container’s GA4 tag configuration and ensure debug settings aren’t being stripped out.
You can verify this by checking the Server Container Preview mode. Look at the outgoing HTTP request to GA4 and confirm the _dbg parameter is present in the URL.
Understanding Data Filters and Reporting Impact
Using DebugView has implications for how your data appears (or doesn’t appear) in reports. This is intentional and useful, but you need to understand how it works.
The Developer Traffic Filter
GA4 includes a filter specifically for debug data called “Developer Traffic”. When this filter is set to “Active”, it does two things:
- Shows data in DebugView: Your debug events appear in DebugView as normal
- Excludes data from reports: Those same events are stripped from Realtime and all standard reports
This is the ideal configuration for clean data. You can test thoroughly without polluting your production metrics with test events.
How to set it up:
- Go to
Admin > Data collection and modification > Data Filters
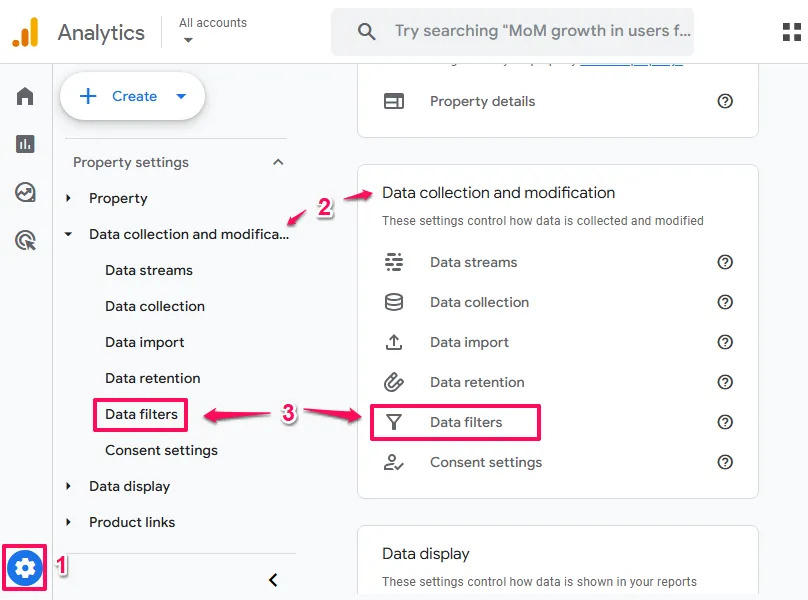
- Find the “Developer Traffic” filter (it exists by default)
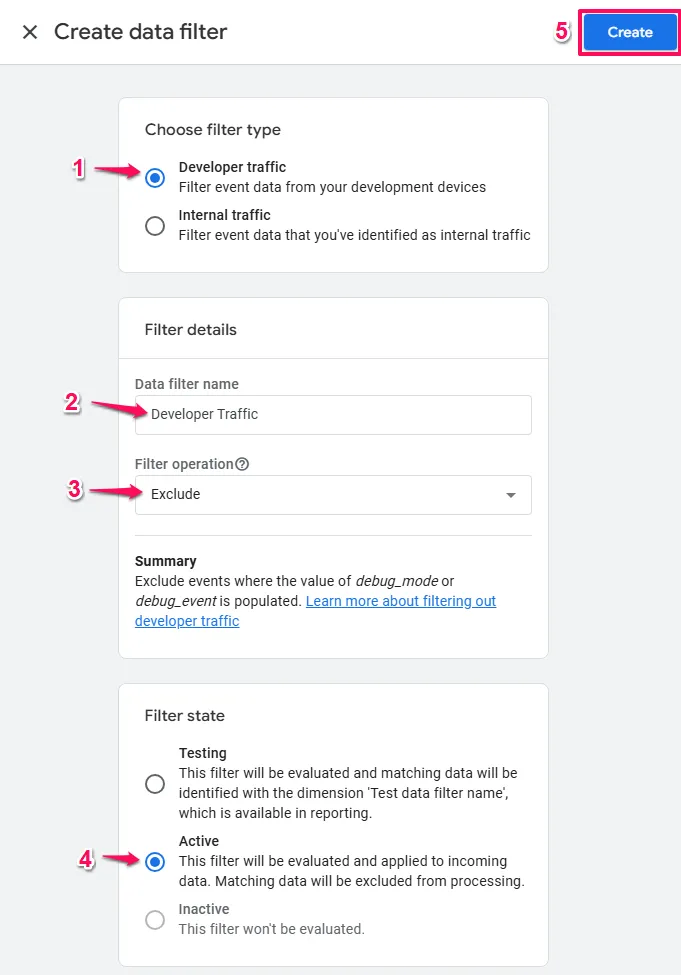
- Set it to “Active”
Filter State Options
GA4 offers three states for data filters:
- Inactive: The filter is turned off. Debug data flows into both DebugView and standard reports.
- Testing: Data is collected everywhere and flagged with a dimension. This lets you see it in reports but identify it as test data.
- Active: Debug data appears in DebugView only, excluded from standard reports.
For most businesses, setting Developer Traffic to “Active” makes the most sense. However, if you’re troubleshooting why data isn’t appearing in reports, temporarily setting it to “Testing” can help you verify the data is actually being collected.
BigQuery Implications
If you export GA4 data to BigQuery, debug events are automatically excluded from your daily export tables. This is good for data quality, but it means you can’t use BigQuery to audit your debug sessions.
If you need to validate how data appears in BigQuery, you’ll need to generate real traffic (without debug mode active) to see it in your data warehouse.
Best Practices for Using GA4 DebugView
1. Test Before Launch
Never publish a new tracking implementation without validating it in DebugView first. The 24-48 hour processing delay in standard reports means you could lose two days of data before discovering a problem.
2. Keep Debug Sessions Focused
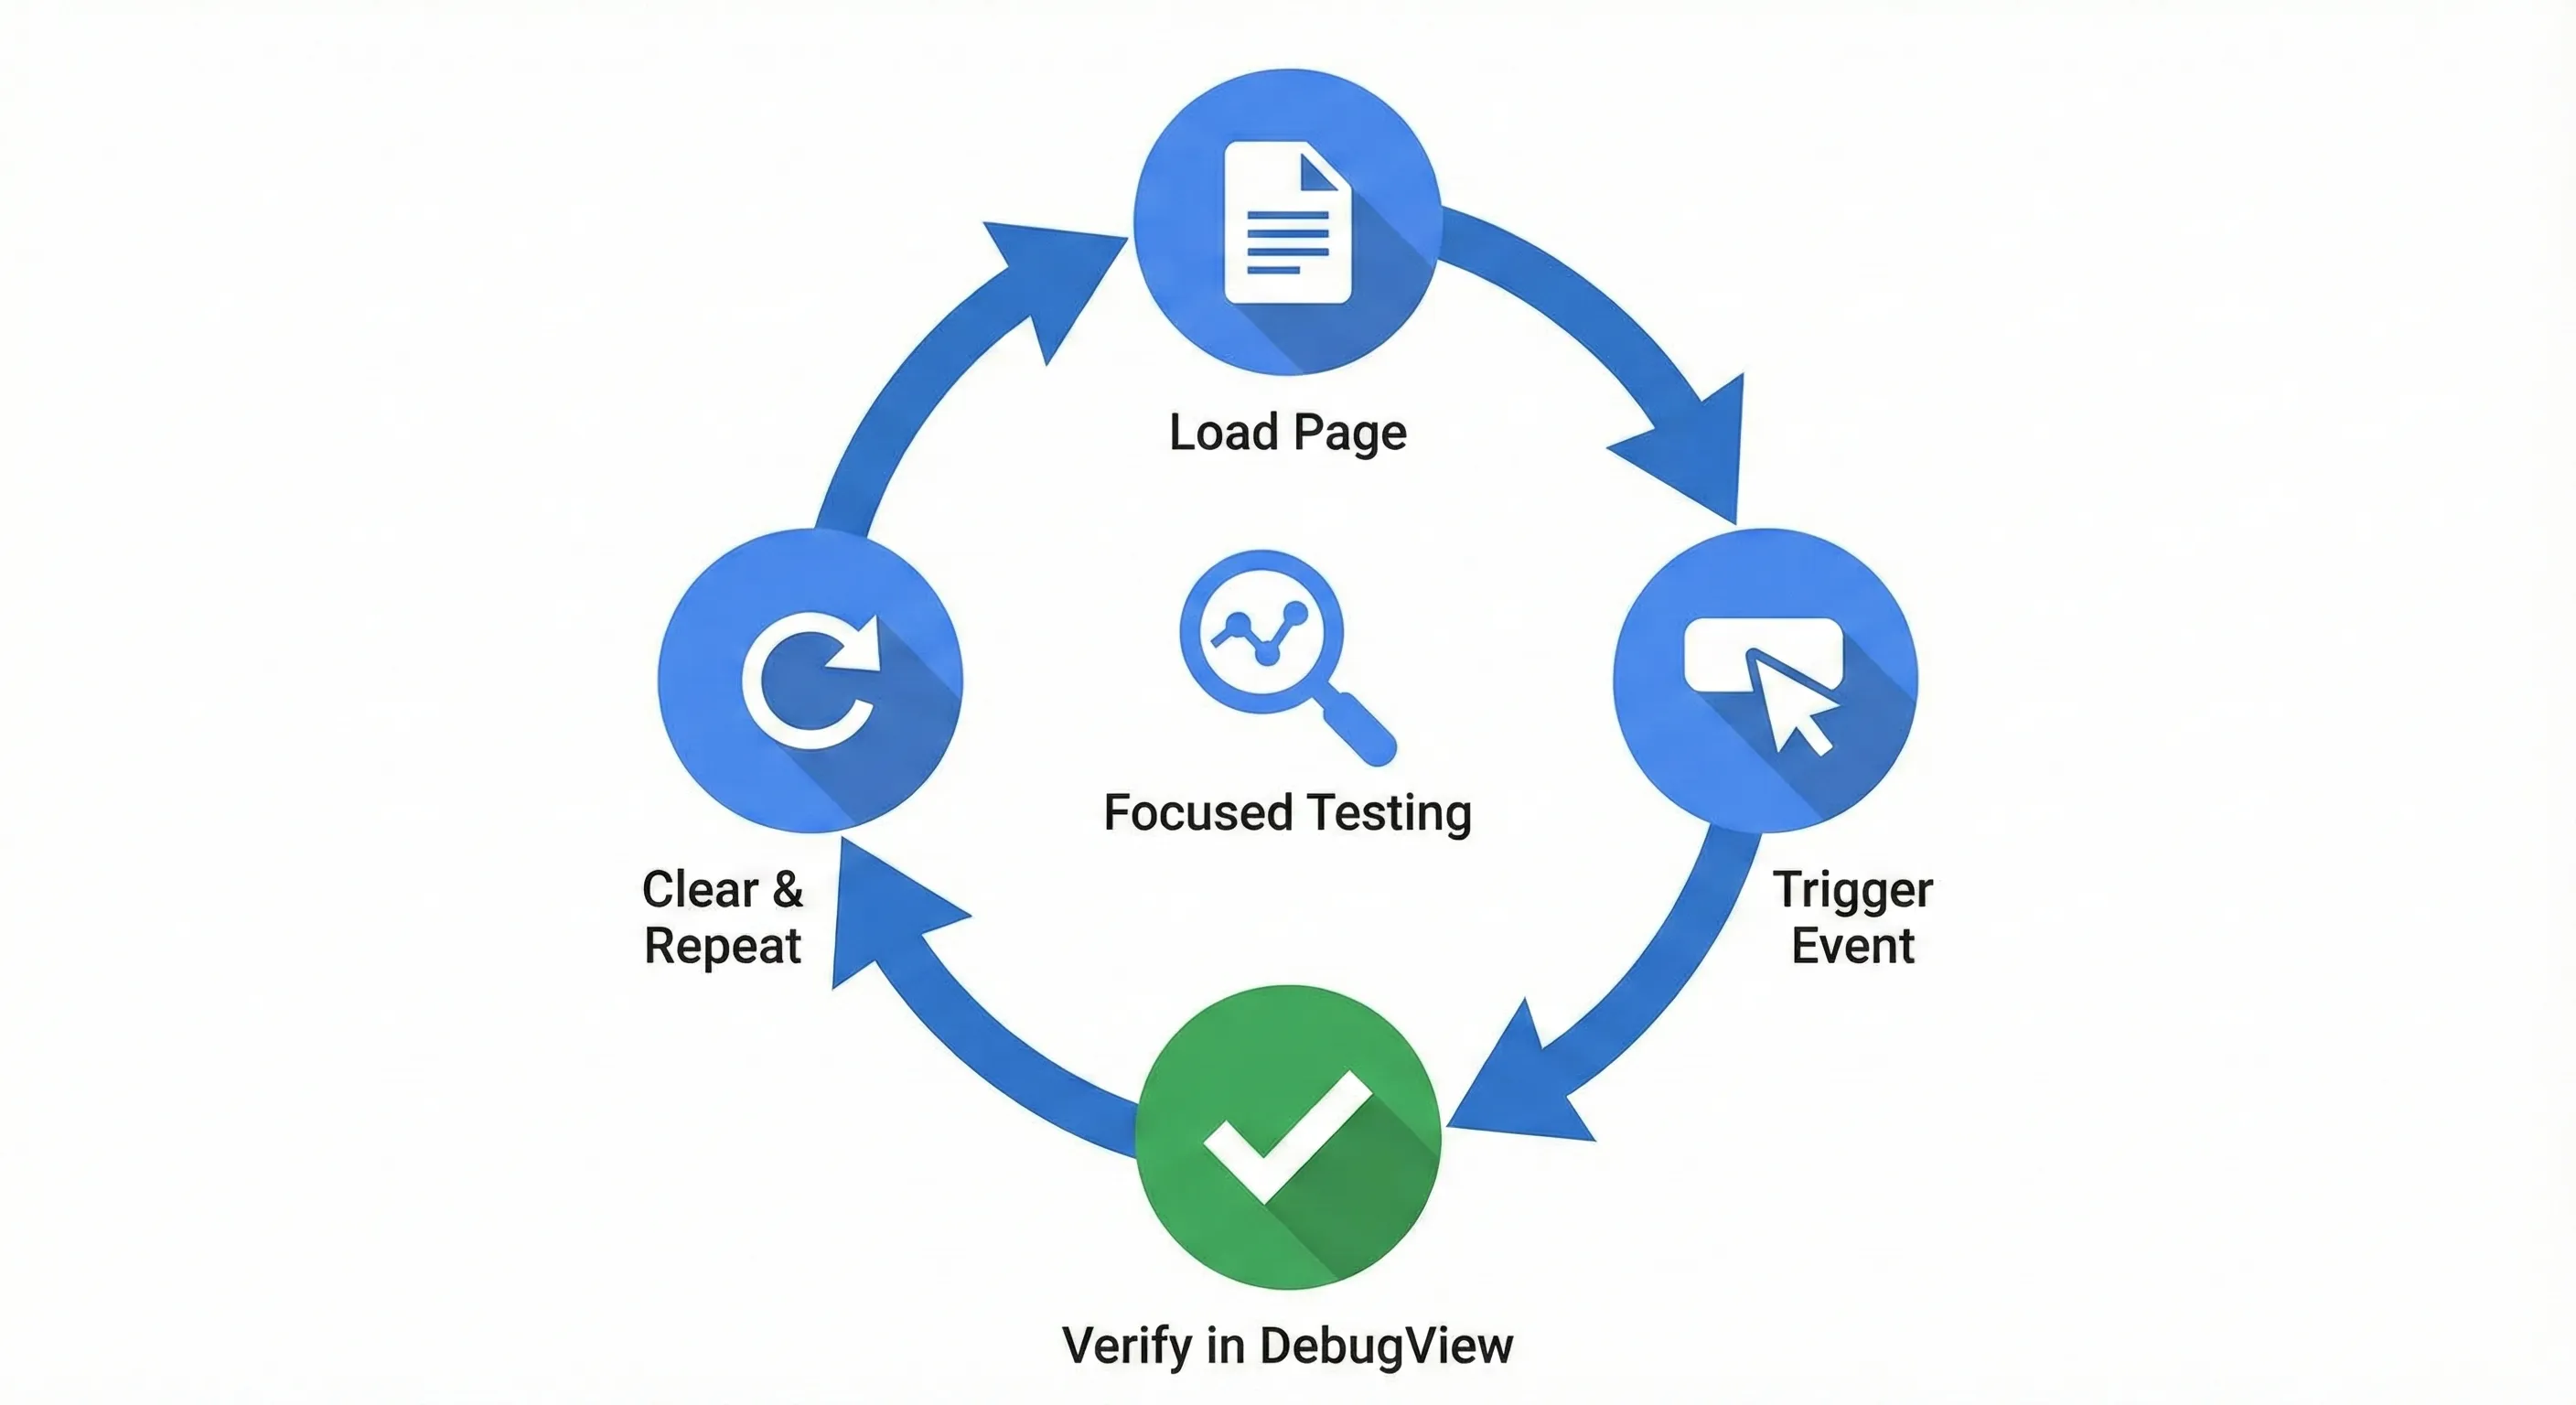
When testing, isolate specific functionalities. Don’t navigate randomly around your site whilst in debug mode. Instead, follow a test plan:
- Load the page
- Trigger the specific event you’re testing
- Verify in DebugView
- Clear and repeat if needed
This focused approach makes it easier to identify which action caused which event, especially in complex implementations.
3. Document Expected vs Actual
When testing, keep notes about what parameters you expect to see and what you actually receive. This documentation helps when troubleshooting discrepancies and creates a reference for future validation.
4. Test Multiple Scenarios
Don’t just test the “happy path”. Try edge cases:
- What happens if someone adds a product to cart without being logged in?
- Does the conversion track correctly if someone uses a discount code?
- What if the user’s browser blocks third-party cookies?
DebugView helps you understand how your tracking behaves in real-world conditions, not just ideal scenarios.
5. Coordinate Team Testing
If multiple team members need to test simultaneously, establish clear communication. With similar device names in the dropdown, it’s easy to watch the wrong stream.
Consider using a shared document where team members log when they’re testing and which device name appears in their DebugView.
When GA4 DebugView Isn’t Enough
GA4 DebugView is powerful for validating that events fire and contain the correct parameters. However, it doesn’t show you everything.
DebugView doesn’t show:
- How data appears in standard reports after processing
- Whether data flows correctly into audiences or segments
- If conversions are being attributed correctly across sessions
- How data appears in connected platforms (like Google Ads)
After validating in DebugView, you still need to check:
- Realtime report (within minutes): Confirm aggregated data appears
- Standard reports (after 24-48 hours): Verify data processes correctly
- Explorations (after 24-48 hours): Check that dimensions and metrics work as expected
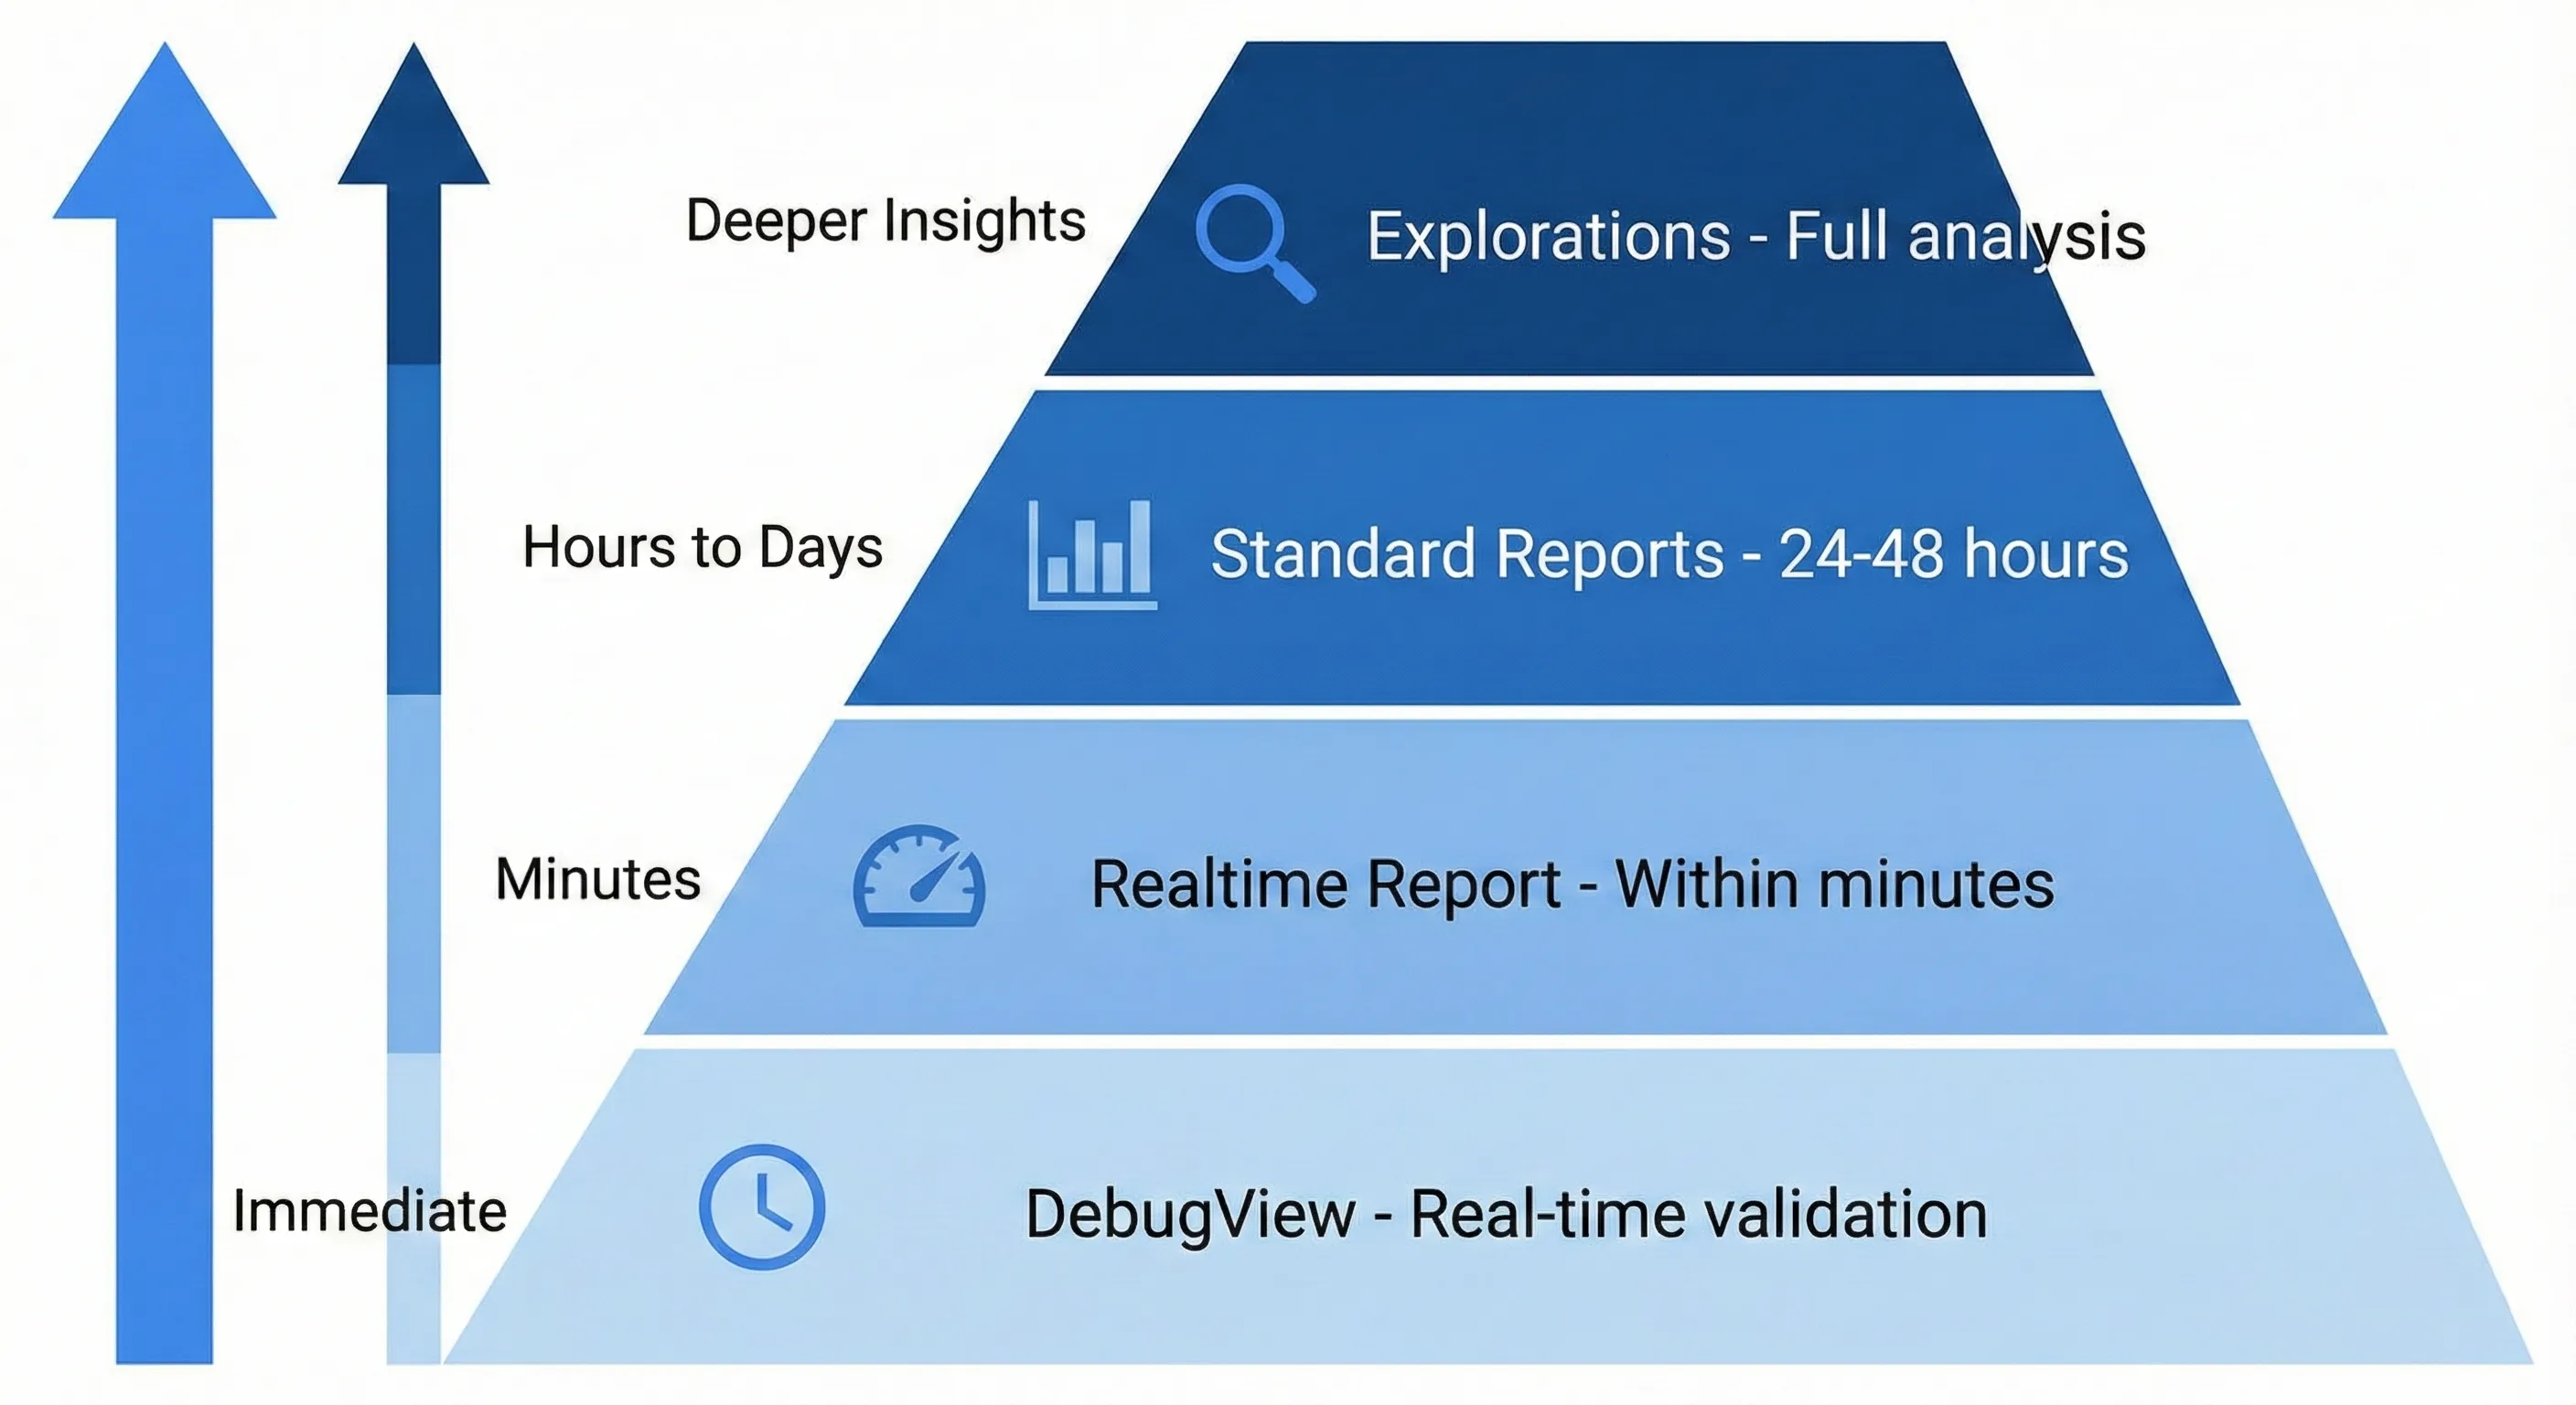
Think of DebugView as the first validation step, not the only validation step.
Next Steps
Build GA4 DebugView Into Your Workflow
Now that you understand how to use DebugView, make it part of your standard process:
Before Every Implementation: Use DebugView to validate tracking before publishing changes. Test new conversion events, ecommerce configurations, or custom parameters in GTM Preview mode, verify the data structure in DebugView, then publish only after confirming everything appears correctly. This prevents the 24-48 hour delay from turning into days of lost data when something breaks.
After Every Website Change: Developers redesigning your site might accidentally break tracking by changing button IDs, form structures, or page URLs. After each deployment, spend 5 minutes in DebugView clicking through critical conversion paths—form submissions, checkout flows, key page views—to verify tracking survived the changes.
When Reports Look Wrong: If conversion numbers suddenly drop or revenue data seems off, DebugView helps diagnose whether the problem is data collection (events aren’t firing) or data processing (events fire correctly but reports are misconfigured). Check the raw event data first before assuming platform issues.
Understanding the Complete Measurement System
DebugView validates that GA4 receives data correctly, but it’s one tool within a complete measurement infrastructure. Proper tracking requires Google Tag Manager to deploy tags, the data layer to structure event data, event tracking to capture behaviors, and conversion configuration to mark important actions. DebugView helps you verify each component works, but it can’t tell you if you’re measuring the right things or if your measurement strategy aligns with business goals.
How to Build Your Marketing Measurement Foundation shows you how DebugView fits into a complete measurement system, helping you verify that data flows correctly from user actions through GTM and the data layer to GA4, ensuring your reports reflect reality rather than implementation errors.
If You Need Help
Using DebugView requires understanding event structures, parameter requirements, ecommerce data formatting, and consent mode signals. Our Marketing Measurement Foundation service provides complete implementation with proper validation testing if you prefer expert setup.
Conclusion
DebugView is essential for anyone implementing or maintaining Google Analytics 4 tracking. It bridges the gap between making changes and seeing results, letting you validate implementations immediately rather than waiting days for data to process.
The key to using it effectively is understanding that it’s an isolated testing environment. Activate debug mode on your specific device, verify your events and parameters are correct, then deactivate debug mode and monitor how that data flows through to reports.
Most DebugView issues stem from the debug flag not being activated correctly, conflicts with data filters, or browser extensions blocking requests. Understanding these common causes helps you troubleshoot quickly when things don’t appear as expected.
By incorporating DebugView into your standard testing workflow, you’ll catch implementation errors before they affect your data, giving you confidence that the decisions you make are based on accurate, reliable information.
Frequently Asked Questions
Why isn’t my GA4 DebugView showing any data?
The most common causes are:
(1) Debug mode isn’t properly enabled – verify the _dbg parameter appears in your GA4 requests using browser Developer Tools,
(2) Ad blockers or privacy extensions are blocking GA4 requests entirely, or
(3) You haven’t selected your device from the dropdown in the top-left corner. If you’ve enabled an Internal Traffic filter and it’s set to “Active,” your IP address might also be excluded from DebugView.
Does DebugView data appear in my regular GA4 reports?
It depends on your Developer Traffic filter settings. If the filter is set to Active, debug data appears only in DebugView and is excluded from all standard reports. If set to Testing, debug data flows into reports but gets flagged with a dimension so you can identify it. If Inactive, debug data appears everywhere alongside regular traffic. For clean data, keep it set to Active.
How long does GA4 DebugView store data?
GA4 DebugView shows activity from the last 30 minutes only. After 30 minutes, events are no longer visible in the interface. The data isn’t stored historically – DebugView is strictly a real-time testing tool, not a reporting interface.
Can I use GA4 DebugView without enabling GTM Preview mode?
Yes. You have three options to enable debug mode: GTM Preview mode, the Google Analytics Debugger Chrome extension, or manually adding the debug_mode parameter to your tags. The Chrome extension is the quickest method if you’re not using GTM or need to test someone else’s site without access to their Tag Manager account. Just remember to turn the extension off when you’re done testing.