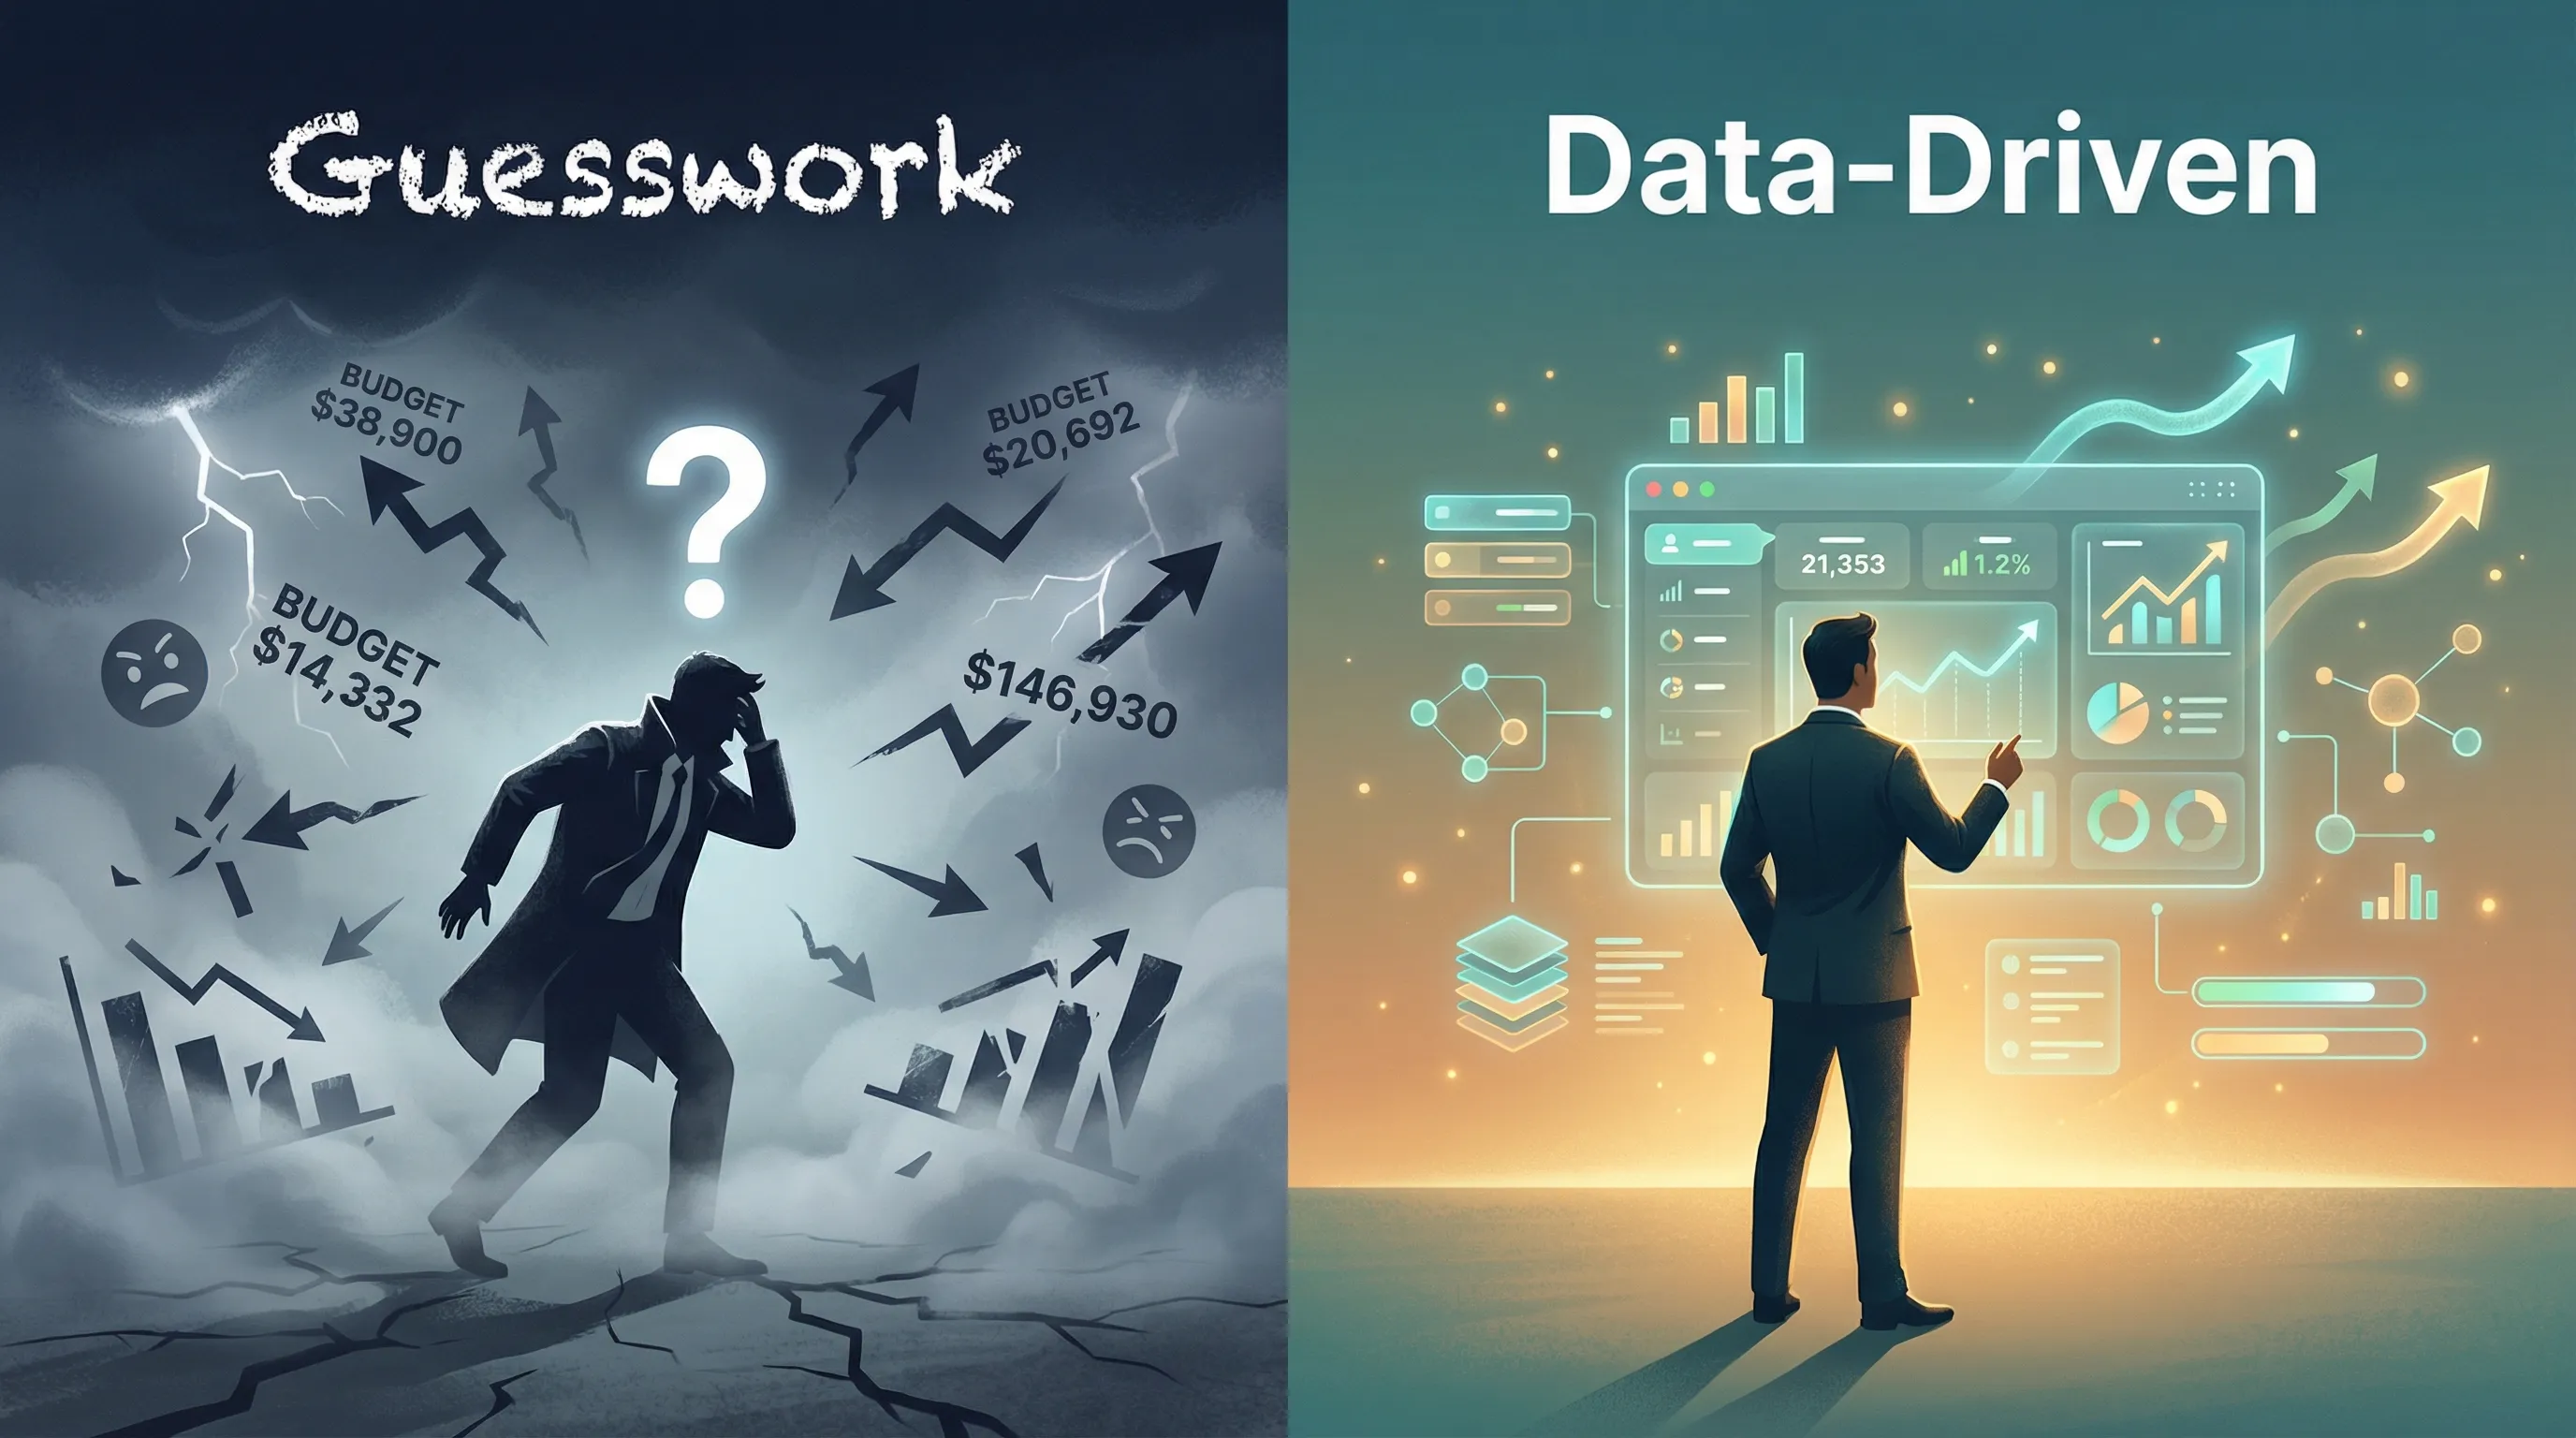
You’re spending money on marketing, but you can’t confidently answer a simple question: “Which of my marketing efforts actually make money?” If you’re nodding along, you’re not alone. The Marketing Centre’s 2024 UK Marketing Maturity Report surveyed 1,988 SME decision-makers and found that 67% lack a clear marketing action plan (meaning they’re deploying capital based on intuition rather than empirical evidence).
The root cause isn’t laziness or incompetence. It’s operating without a proper measurement foundation. When you can’t see which traffic sources drive revenue, you’re forced to guess. You increase spending on channels that feel right, cut budgets based on gut instinct, and repeat the cycle while your competitors use data to systematically outmanoeuvre you.
This guide introduces the Marketing Measurement Foundation (MMF), a standardised analytics infrastructure that transforms guesswork into knowledge. By the end, you’ll understand exactly which tools you need, why you need them, and how they work together to answer your most critical business questions.
Table of Contents
The Cost of Flying Blind: Understanding the Outcomes at Stake
The real cost of flying blind isn’t confusion. It’s the outcomes you fail to achieve because you couldn’t see clearly enough to pursue them.
What Outcomes Actually Matter?
The businesses that avoid this waste have clarity on their desired outcomes. For most SMBs, these outcomes include:
Revenue and Growth:
- Growing sales revenue from current levels to specific targets
- Increasing qualified leads by measurable percentages
- Expanding market share in specific segments
Operational Excellence:
- Reducing customer acquisition costs
- Improving marketing efficiency and ROI
- Eliminating waste on ineffective channels
Customer Success:
- Increasing customer lifetime value
- Improving retention and repeat purchase rates
- Enhancing customer satisfaction scores
The Marketing Measurement Foundation exists to help you achieve these outcomes by making the invisible visible. When you can see what’s working, you can systematically do more of it. When you can see what’s failing, you can stop paying for it.
The Behaviours That Create Outcomes
Outcomes don’t happen by magic. They occur when specific behaviours take place in a predictable sequence. Understanding this behaviour chain is crucial because you can’t directly control outcomes, but you can influence the behaviours that create them.
For web businesses, user behaviours follow a narrative arc that we call the ARC framework: Aware, Review, Convert.
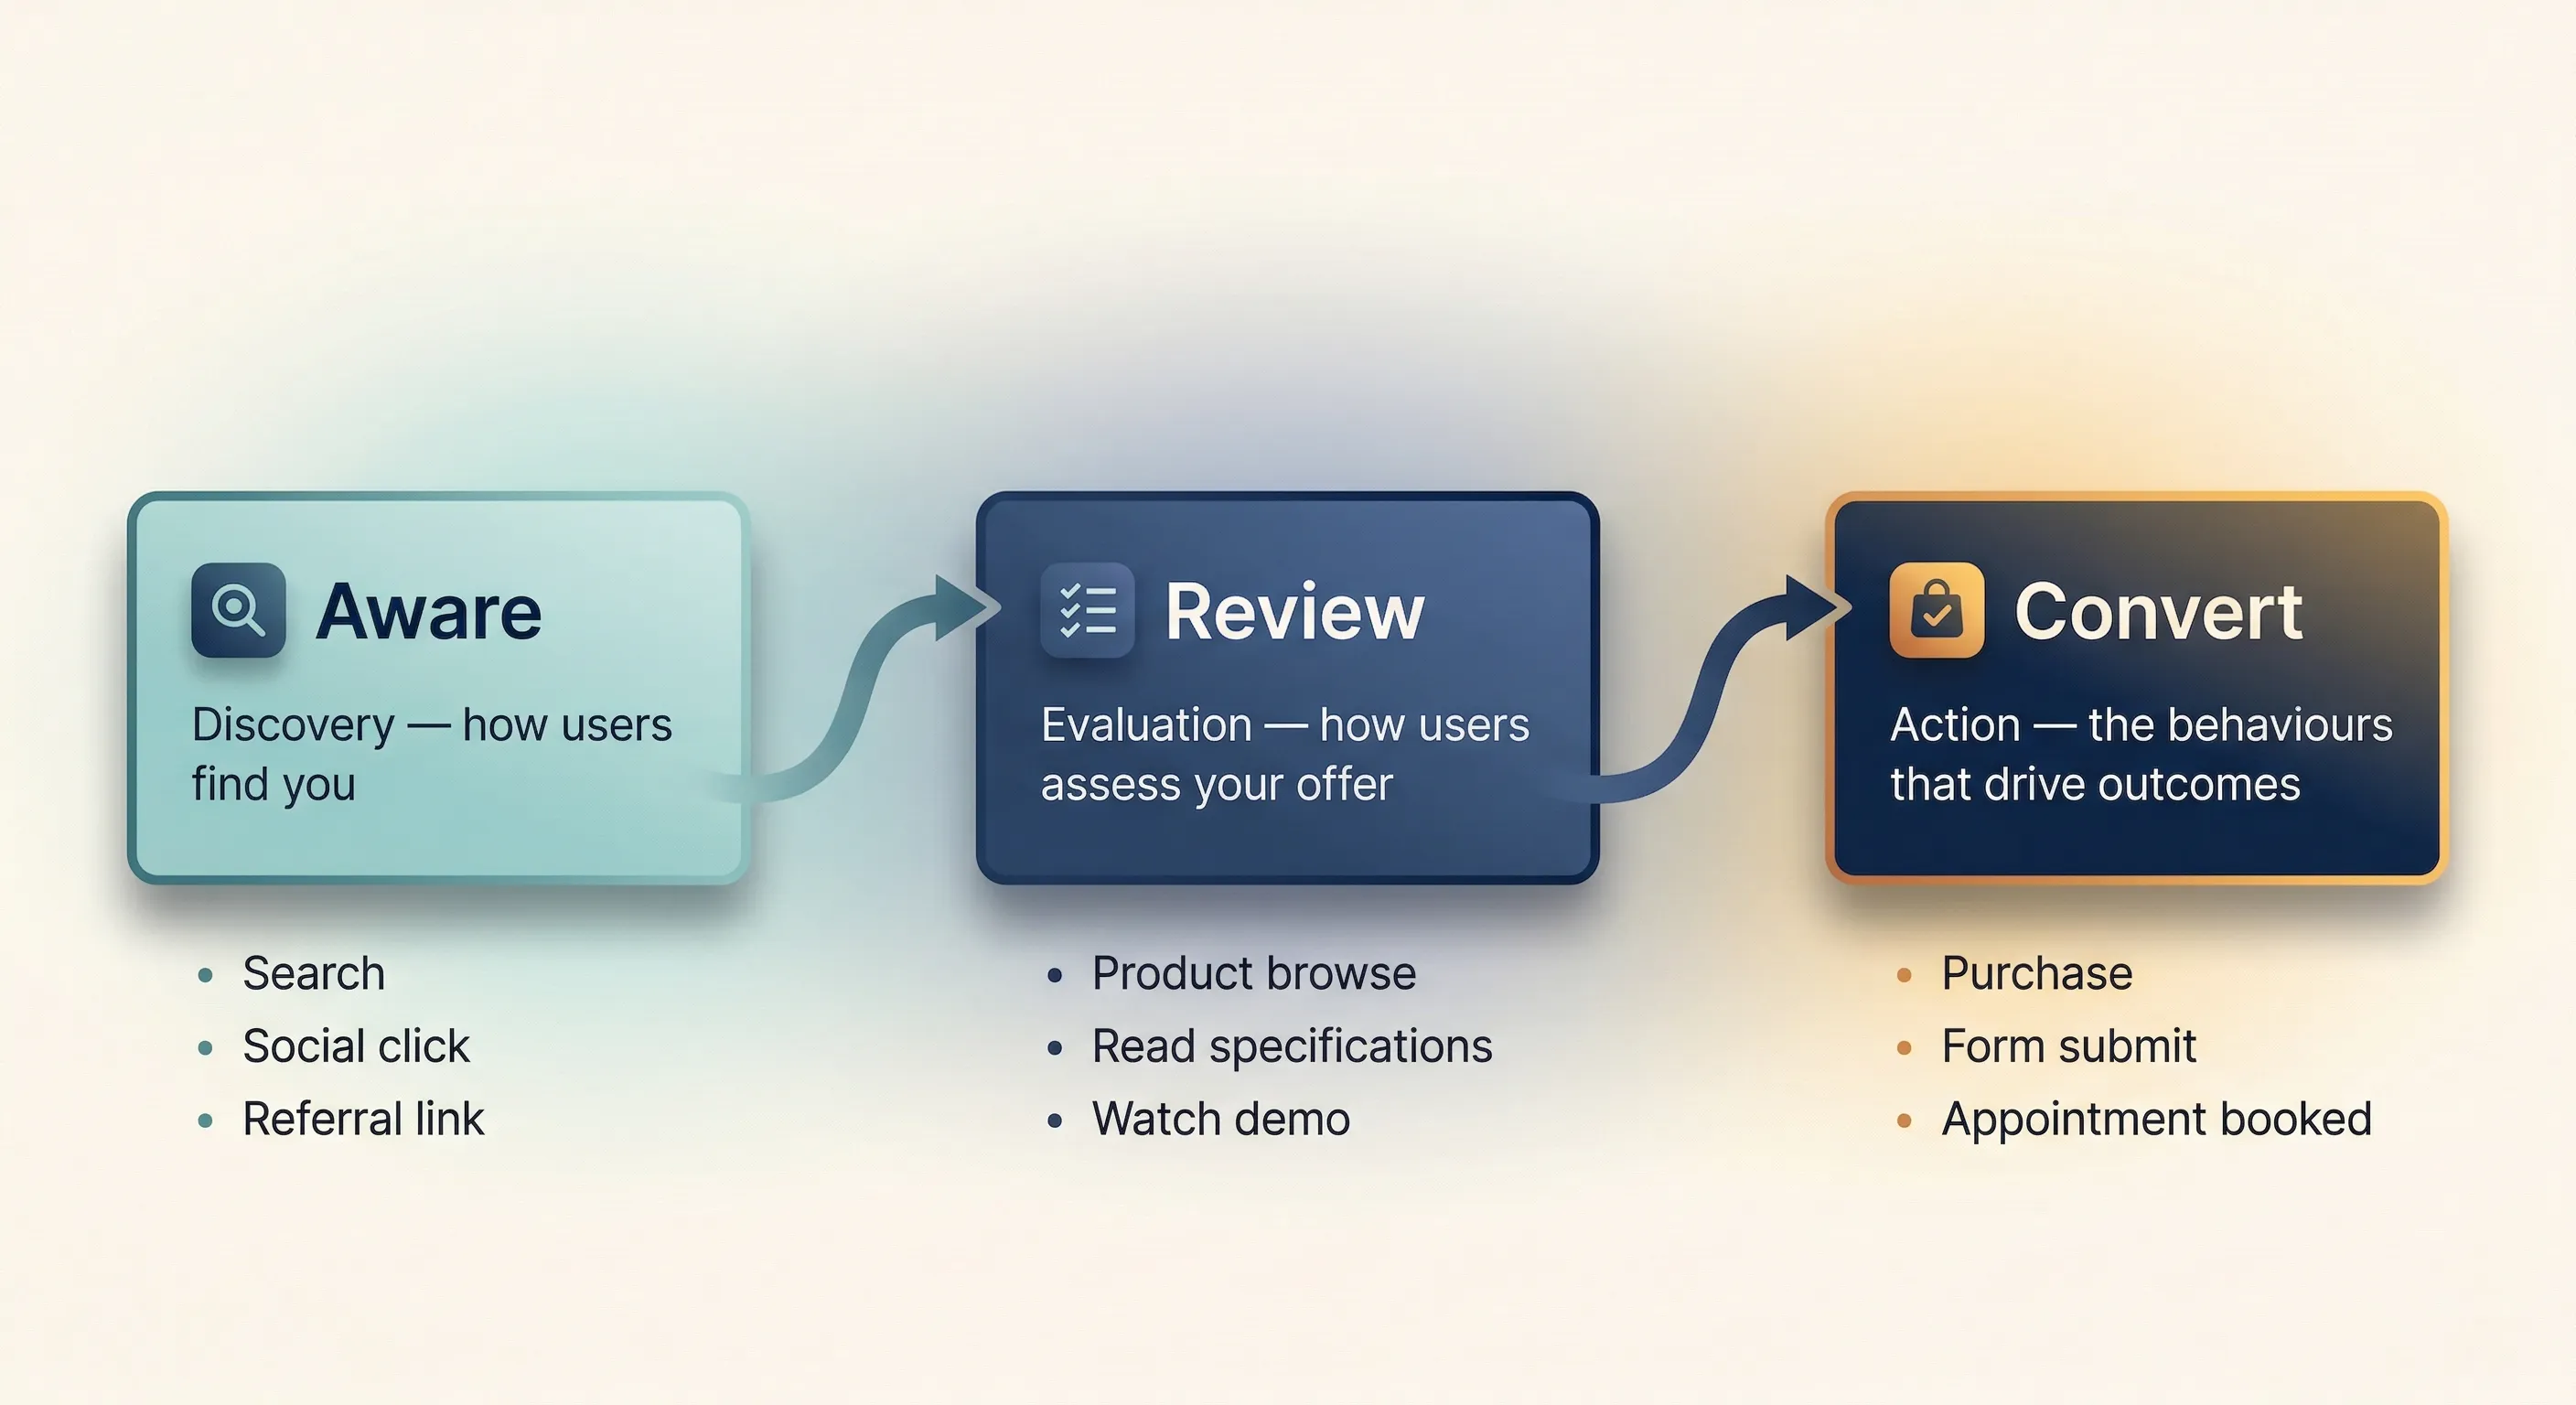
Aware: How Users Discover Your Offers
This is the top of your funnel. Discovery behaviours include:
- Finding your site through search engines after typing queries related to your solution.
- Clicking on social media posts featuring your products or content.
- Following referral links from other websites, influencers, or partners.
- Typing your URL directly after hearing about you offline.
- Clicking paid advertisements on Google, Facebook, or other platforms.
Each discovery method represents a different type of user intent and typically converts at different rates. Someone actively searching “buy sustainable fashion UK” has higher purchase intent than someone who saw your Instagram ad while scrolling.
Review: How Users Evaluate Your Offer
Once users discover you, they evaluate whether you solve their problem. Review behaviours include:
- Browsing multiple product pages or service descriptions.
- Reading detailed specifications, sizing guides, or technical documentation.
- Watching demo videos, tutorials, or customer testimonials.
- Downloading resources like pricing guides, case studies, or whitepapers.
- Comparing your features and prices with competitors.
- Reading customer reviews and viewing user-generated content.
- Engaging with interactive tools like calculators or configurators.
The depth and duration of review behaviours often predict conversion likelihood. Someone who views ten pages over three sessions shows higher intent than someone who bounces after viewing one page for fifteen seconds.
Convert: The Actions That Drive Outcomes
This is where behaviours directly create your desired outcomes. Conversion behaviours include:
- Making purchases and completing checkout.
- Signing up for accounts or memberships.
- Submitting contact forms or consultation requests.
- Subscribing to newsletters or email lists.
- Booking appointments or demos.
- Downloading gated content like ebooks or templates.
These conversion behaviours are the bridge between marketing activity and business results. Every outcome metric you care about (revenue, leads, customers) is built from these specific, measurable actions.
Why This Behaviour Framework Matters for Measurement
Understanding the ARC framework changes how you approach analytics. Instead of passively observing whatever data appears in reports, you actively track the behaviours that predict and create outcomes.
If you want to grow revenue, you need visibility into:
- Which channels drive Aware behaviours (traffic sources)
- Which content facilitates Review behaviours (engagement patterns)
- Which touchpoints complete Convert behaviours (conversion paths)
This behaviour map becomes the foundation for determining what questions you need to answer and, subsequently, what tools you need to answer them.
The Questions You Must Answer
Your desired outcomes and the behaviours that drive them determine which questions matter for your business. These aren’t theoretical questions. They’re the specific inquiries that, when answered with data, allow you to make confident decisions about where to invest resources.
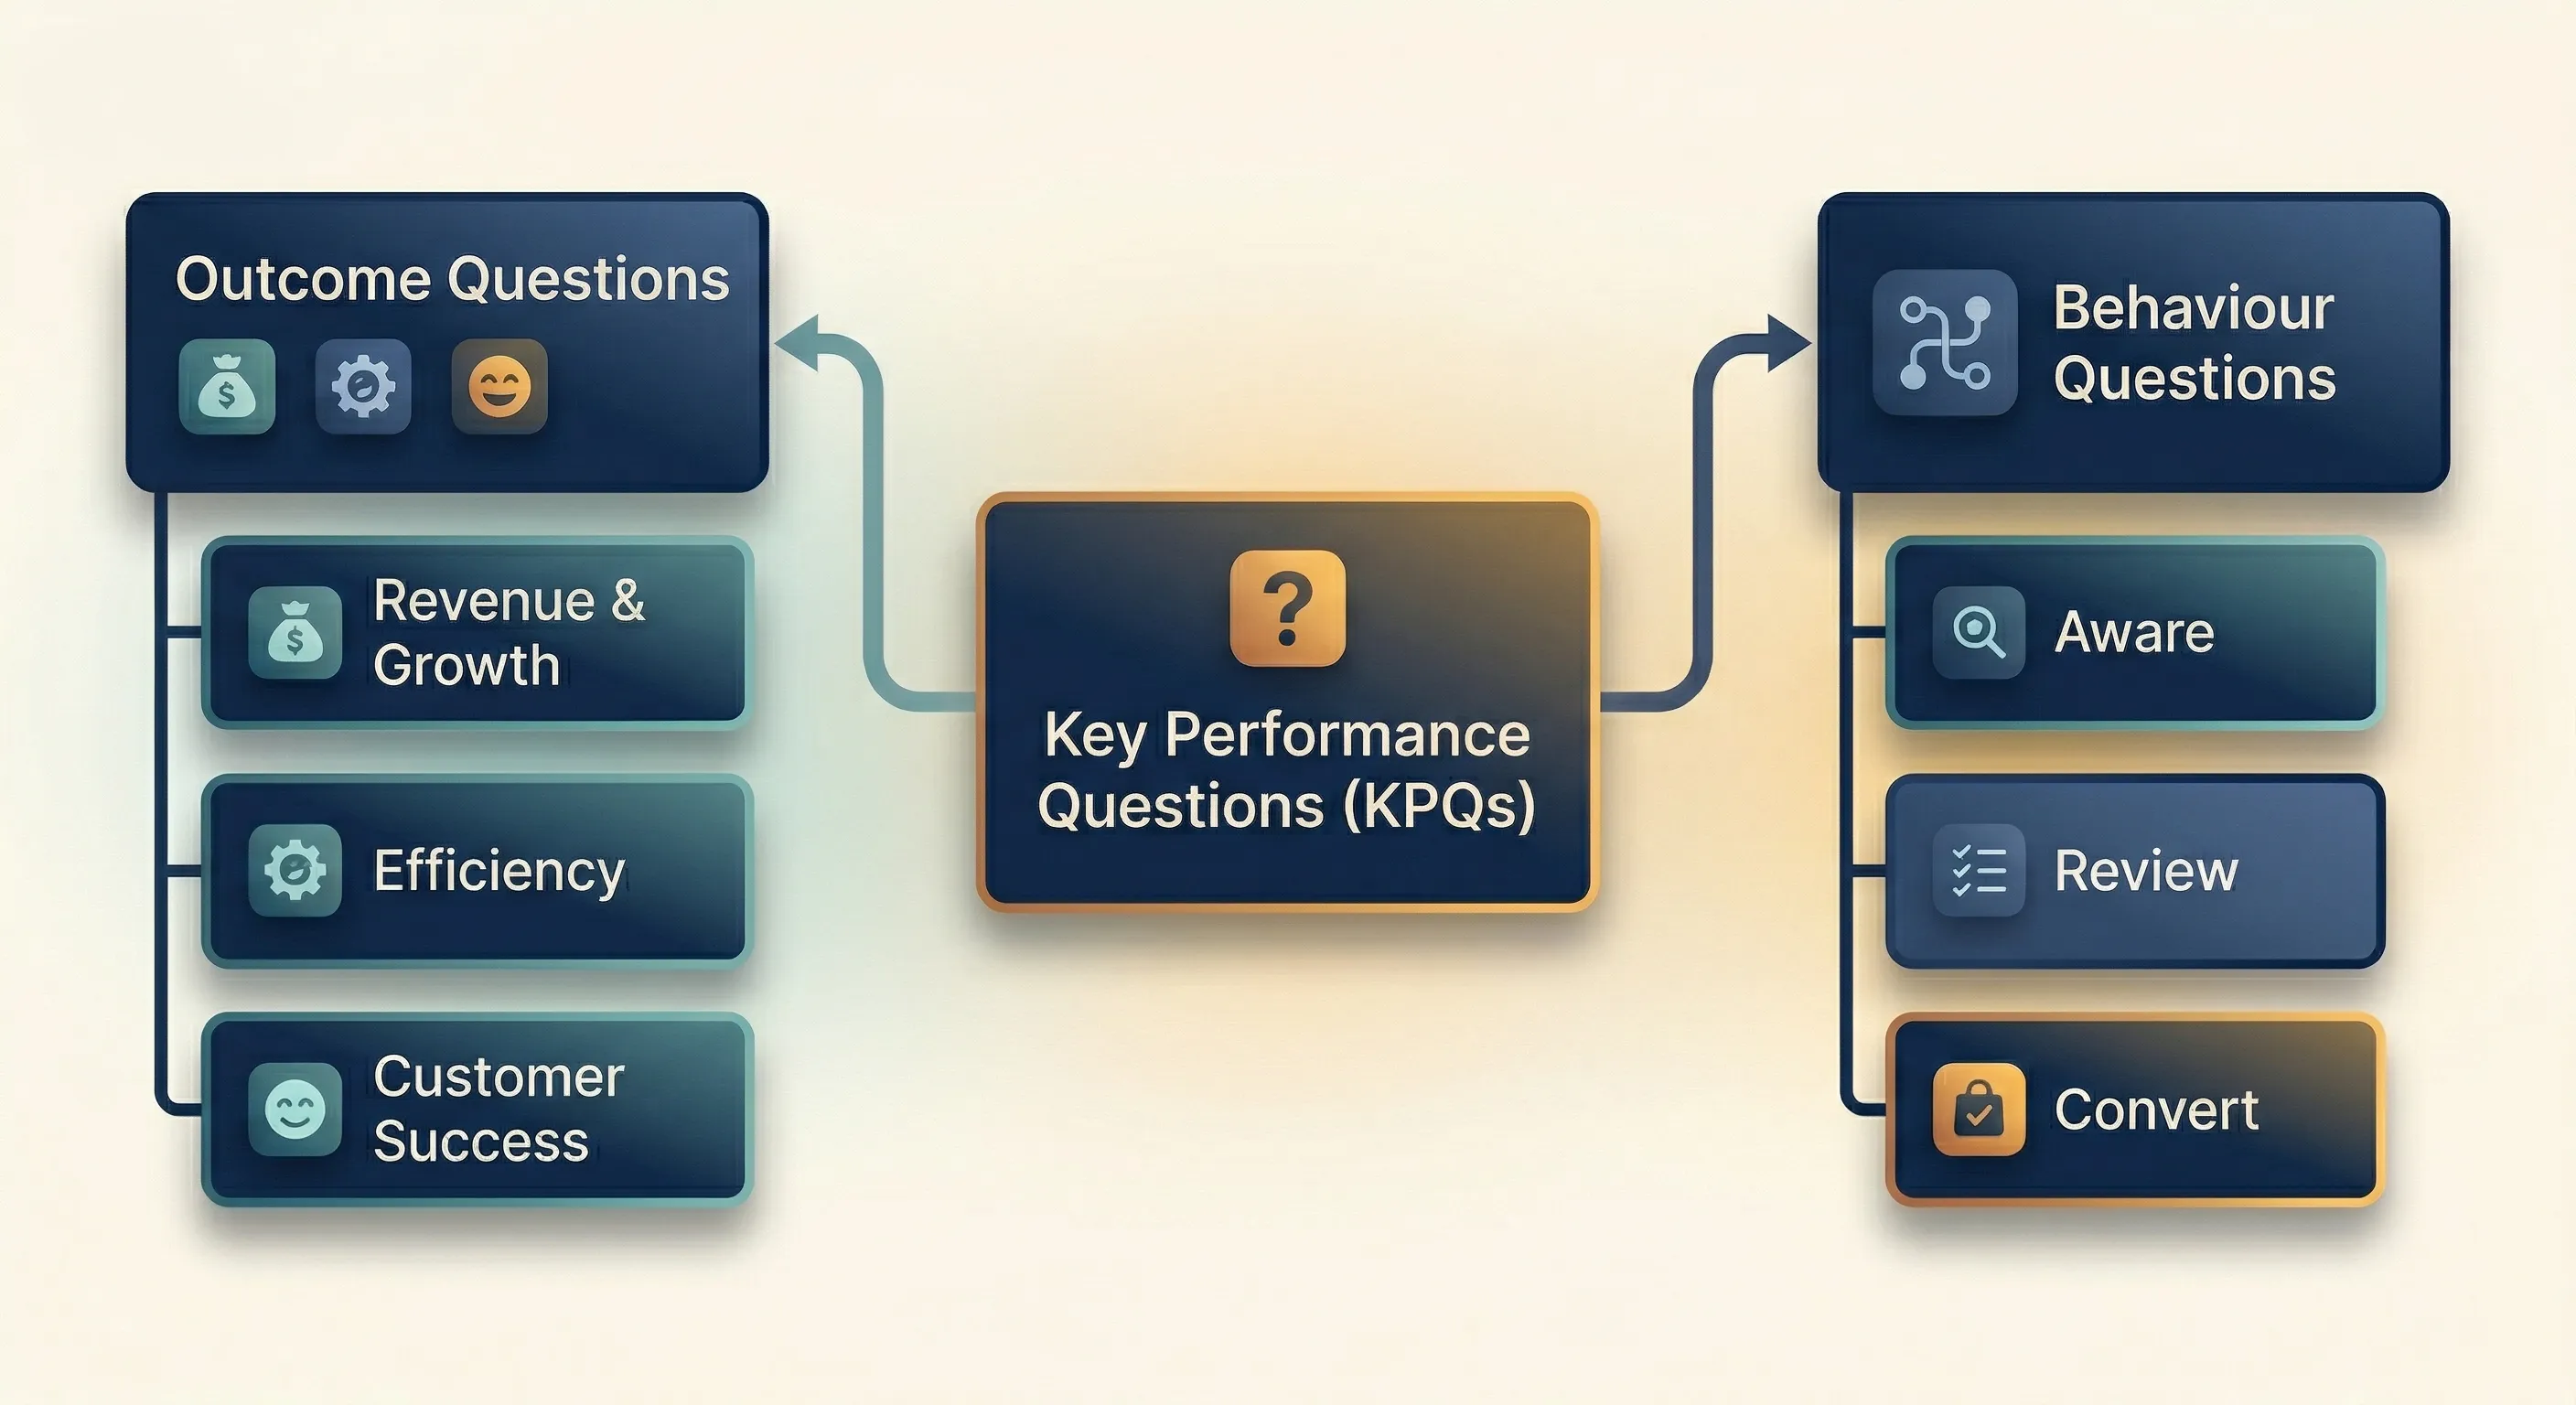
We call these Key Performance Questions (KPQs, a term we borrowed from Bernard Marr). They come in two types: Outcome Questions and Behaviour Questions.
Outcome Questions: Measuring Results
These questions focus on the end results you’re trying to achieve:
Revenue and Growth Questions:
- What is our monthly revenue growth rate, and are we on track to hit annual targets?
- What is our average order value, and how does it vary by customer segment?
- What is our customer lifetime value compared to acquisition cost?
Efficiency Questions:
- What is our cost per acquisition by marketing channel?
- What is our return on ad spend across all campaigns?
- Which marketing channels deliver the lowest cost per customer?
Customer Success Questions:
- What percentage of customers make repeat purchases within 90 days?
- What is our customer retention rate at 6, 12, and 24 months?
- Which customer segments have the highest lifetime value?
Behaviour Questions: Understanding the Journey
These questions focus on the actions that create outcomes:
Aware Stage Questions:
- Where is traffic coming from? (Aware).
- What search terms do people use to find businesses like ours? (Aware).
- How much does it cost to acquire a visitor from each traffic source? (Aware).
Review Stage Questions:
- Which traffic sources bring visitors who take time to explore what we offer? (Aware → Review)
- Which pages do visitors view before making a purchase decision? (Review → Convert).
- How long does it take visitors to decide whether to buy from us? (Review → Convert).
- Where do potential customers get confused, frustrated, or stuck? (Review).
- Which product categories or content types generate the most engagement? (Review).
Convert Stage Questions:
- What is our conversion rate overall and by traffic source? (Aware → Convert).
- Which traffic sources convert at the highest rate? (Aware → Convert).
- What obstacles prevent more visitors from completing checkout or submitting forms? (Review).
- Which user segments (device, location, time of day) convert most effectively? (Convert).
Some questions span more than one stage, and that’s fine. What matters is that you’re asking questions across all three: Aware, Review, and Convert. If your questions only cover one stage, you have blind spots in your funnel.
The Critical Insight: Questions Determine Tools
Here’s where most SMBs get measurement wrong: they implement tools first, then try to figure out what to do with the data. This is backwards.
The correct sequence is:
- Define your desired outcomes
- Map the behaviours that create those outcomes
- Formulate the questions you need to answer
- Identify which tools provide the data to answer those questions
Questions help you narrow down the data you need to consider. Every tool in the Marketing Measurement Foundation exists to get the right data and present it appropriately to answer your questions.
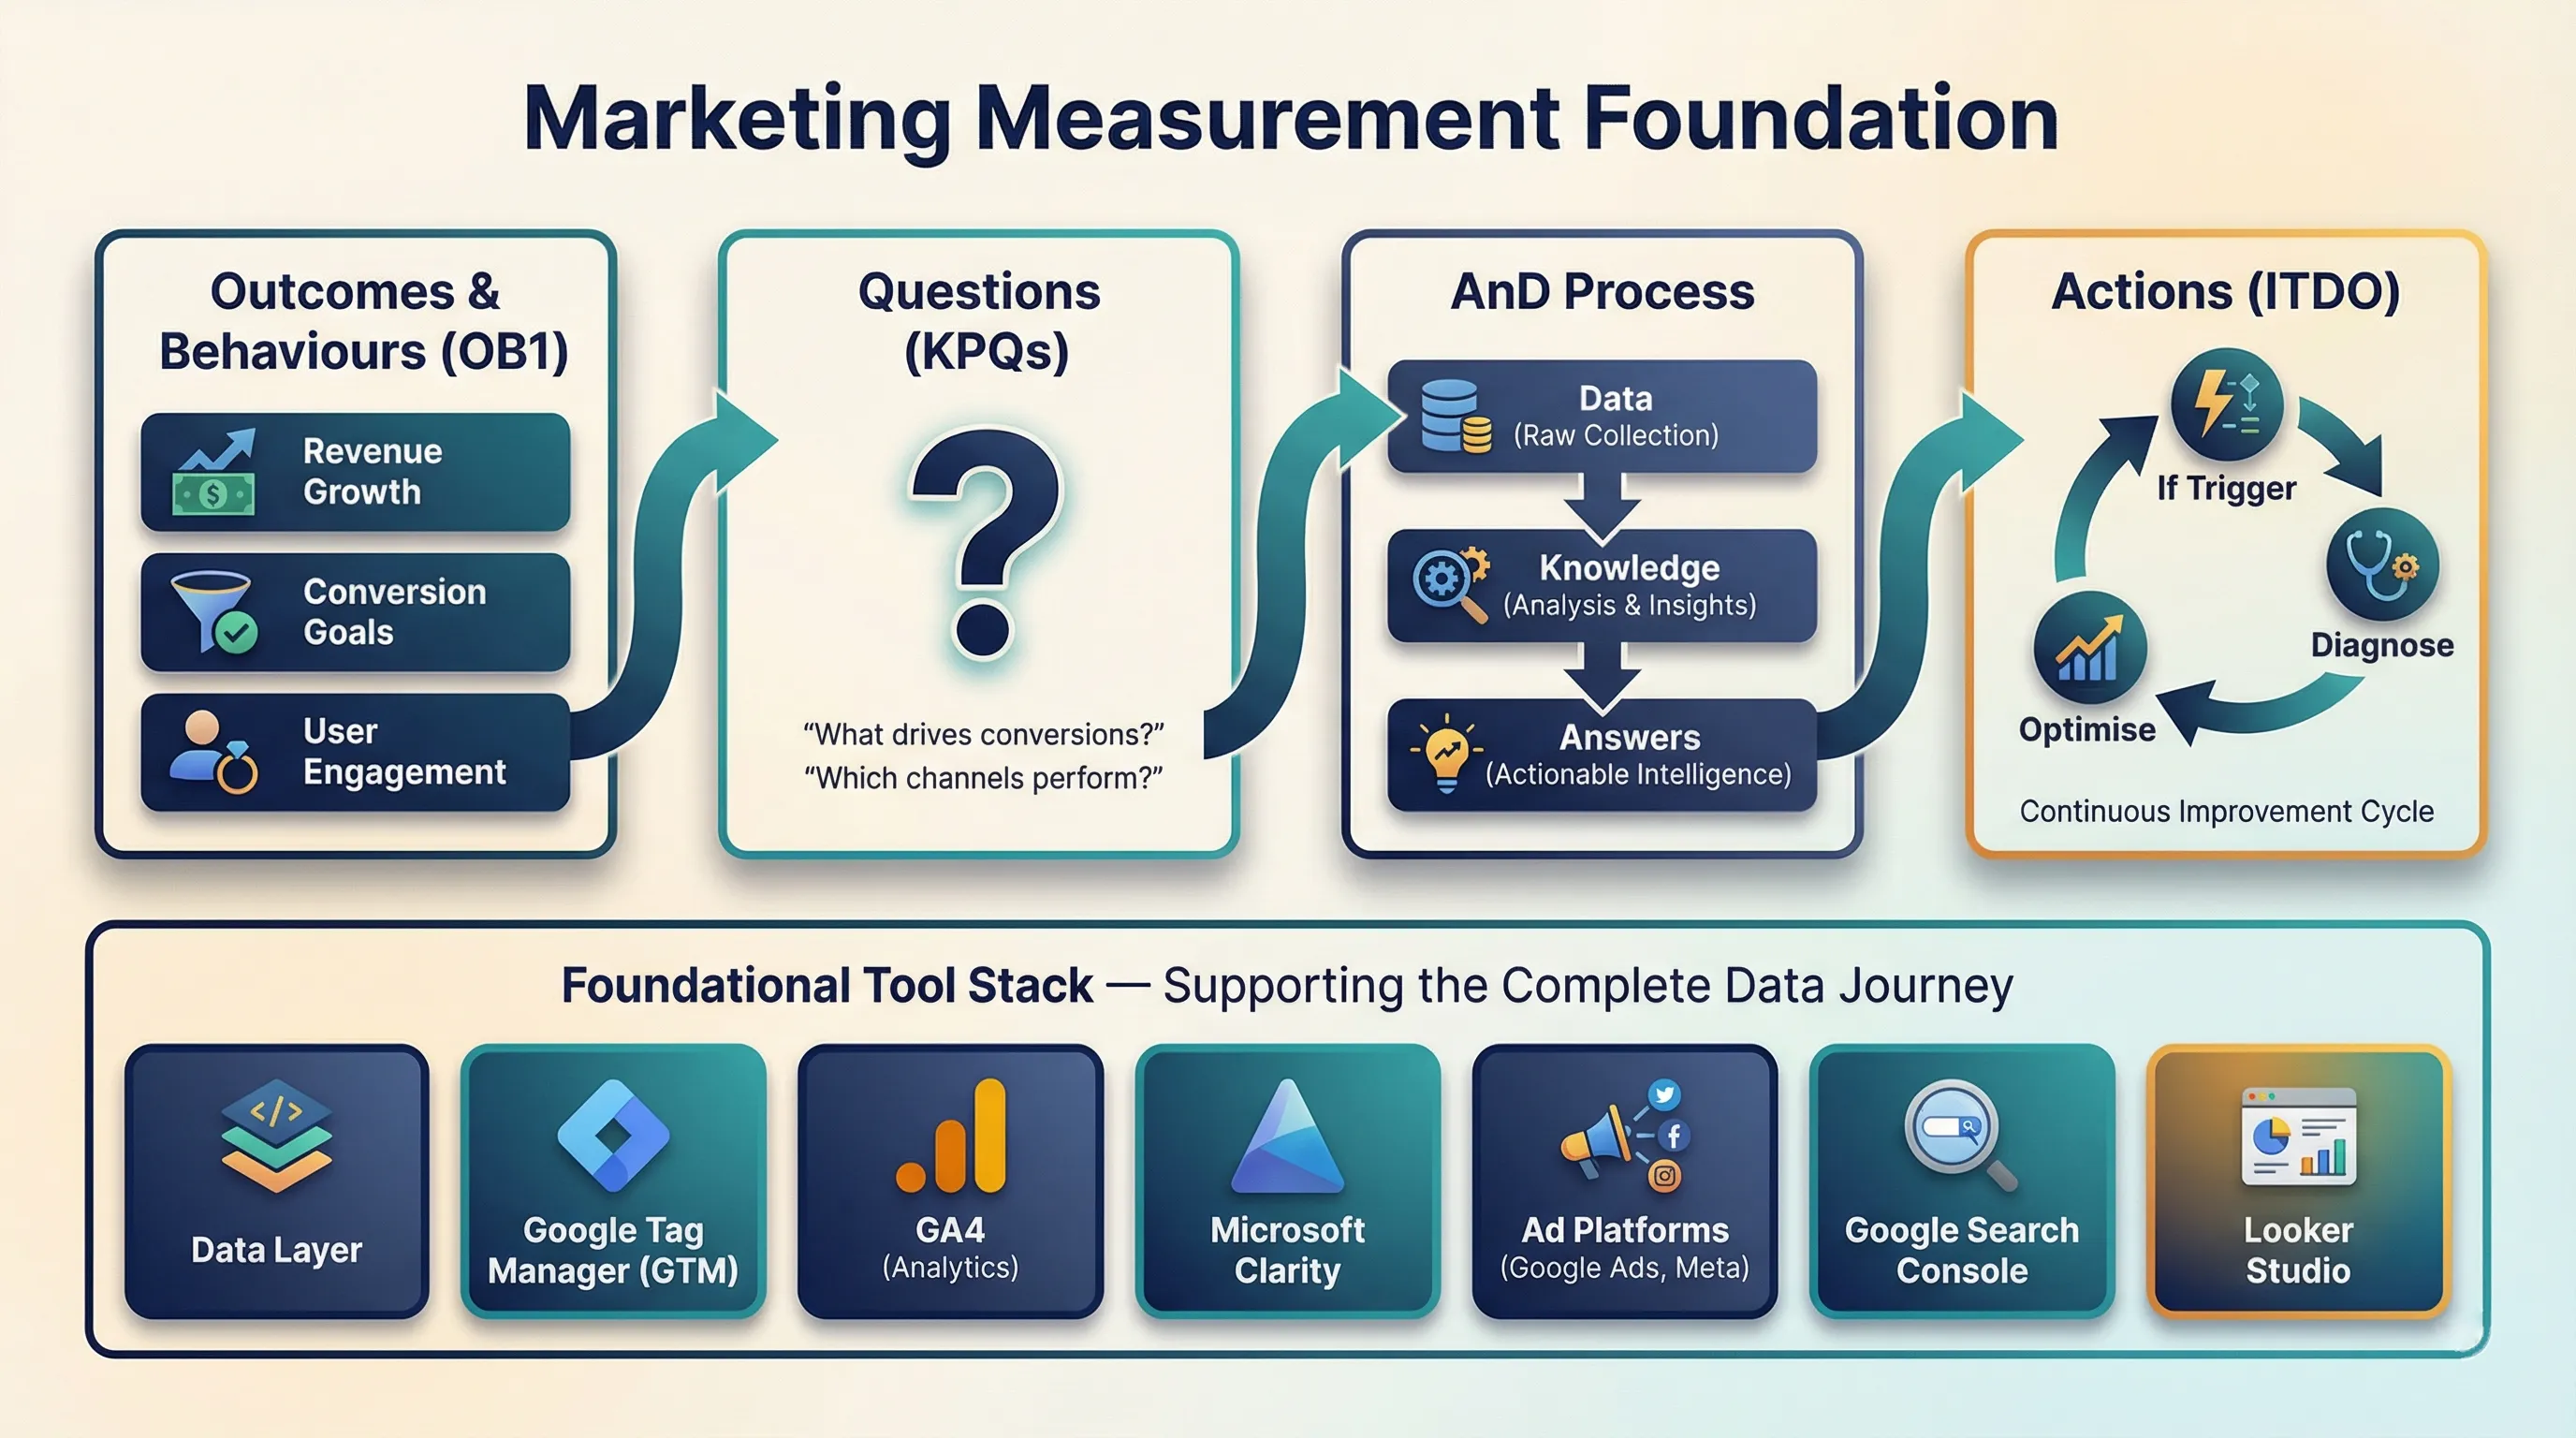
From Data to Answers: The Implementation
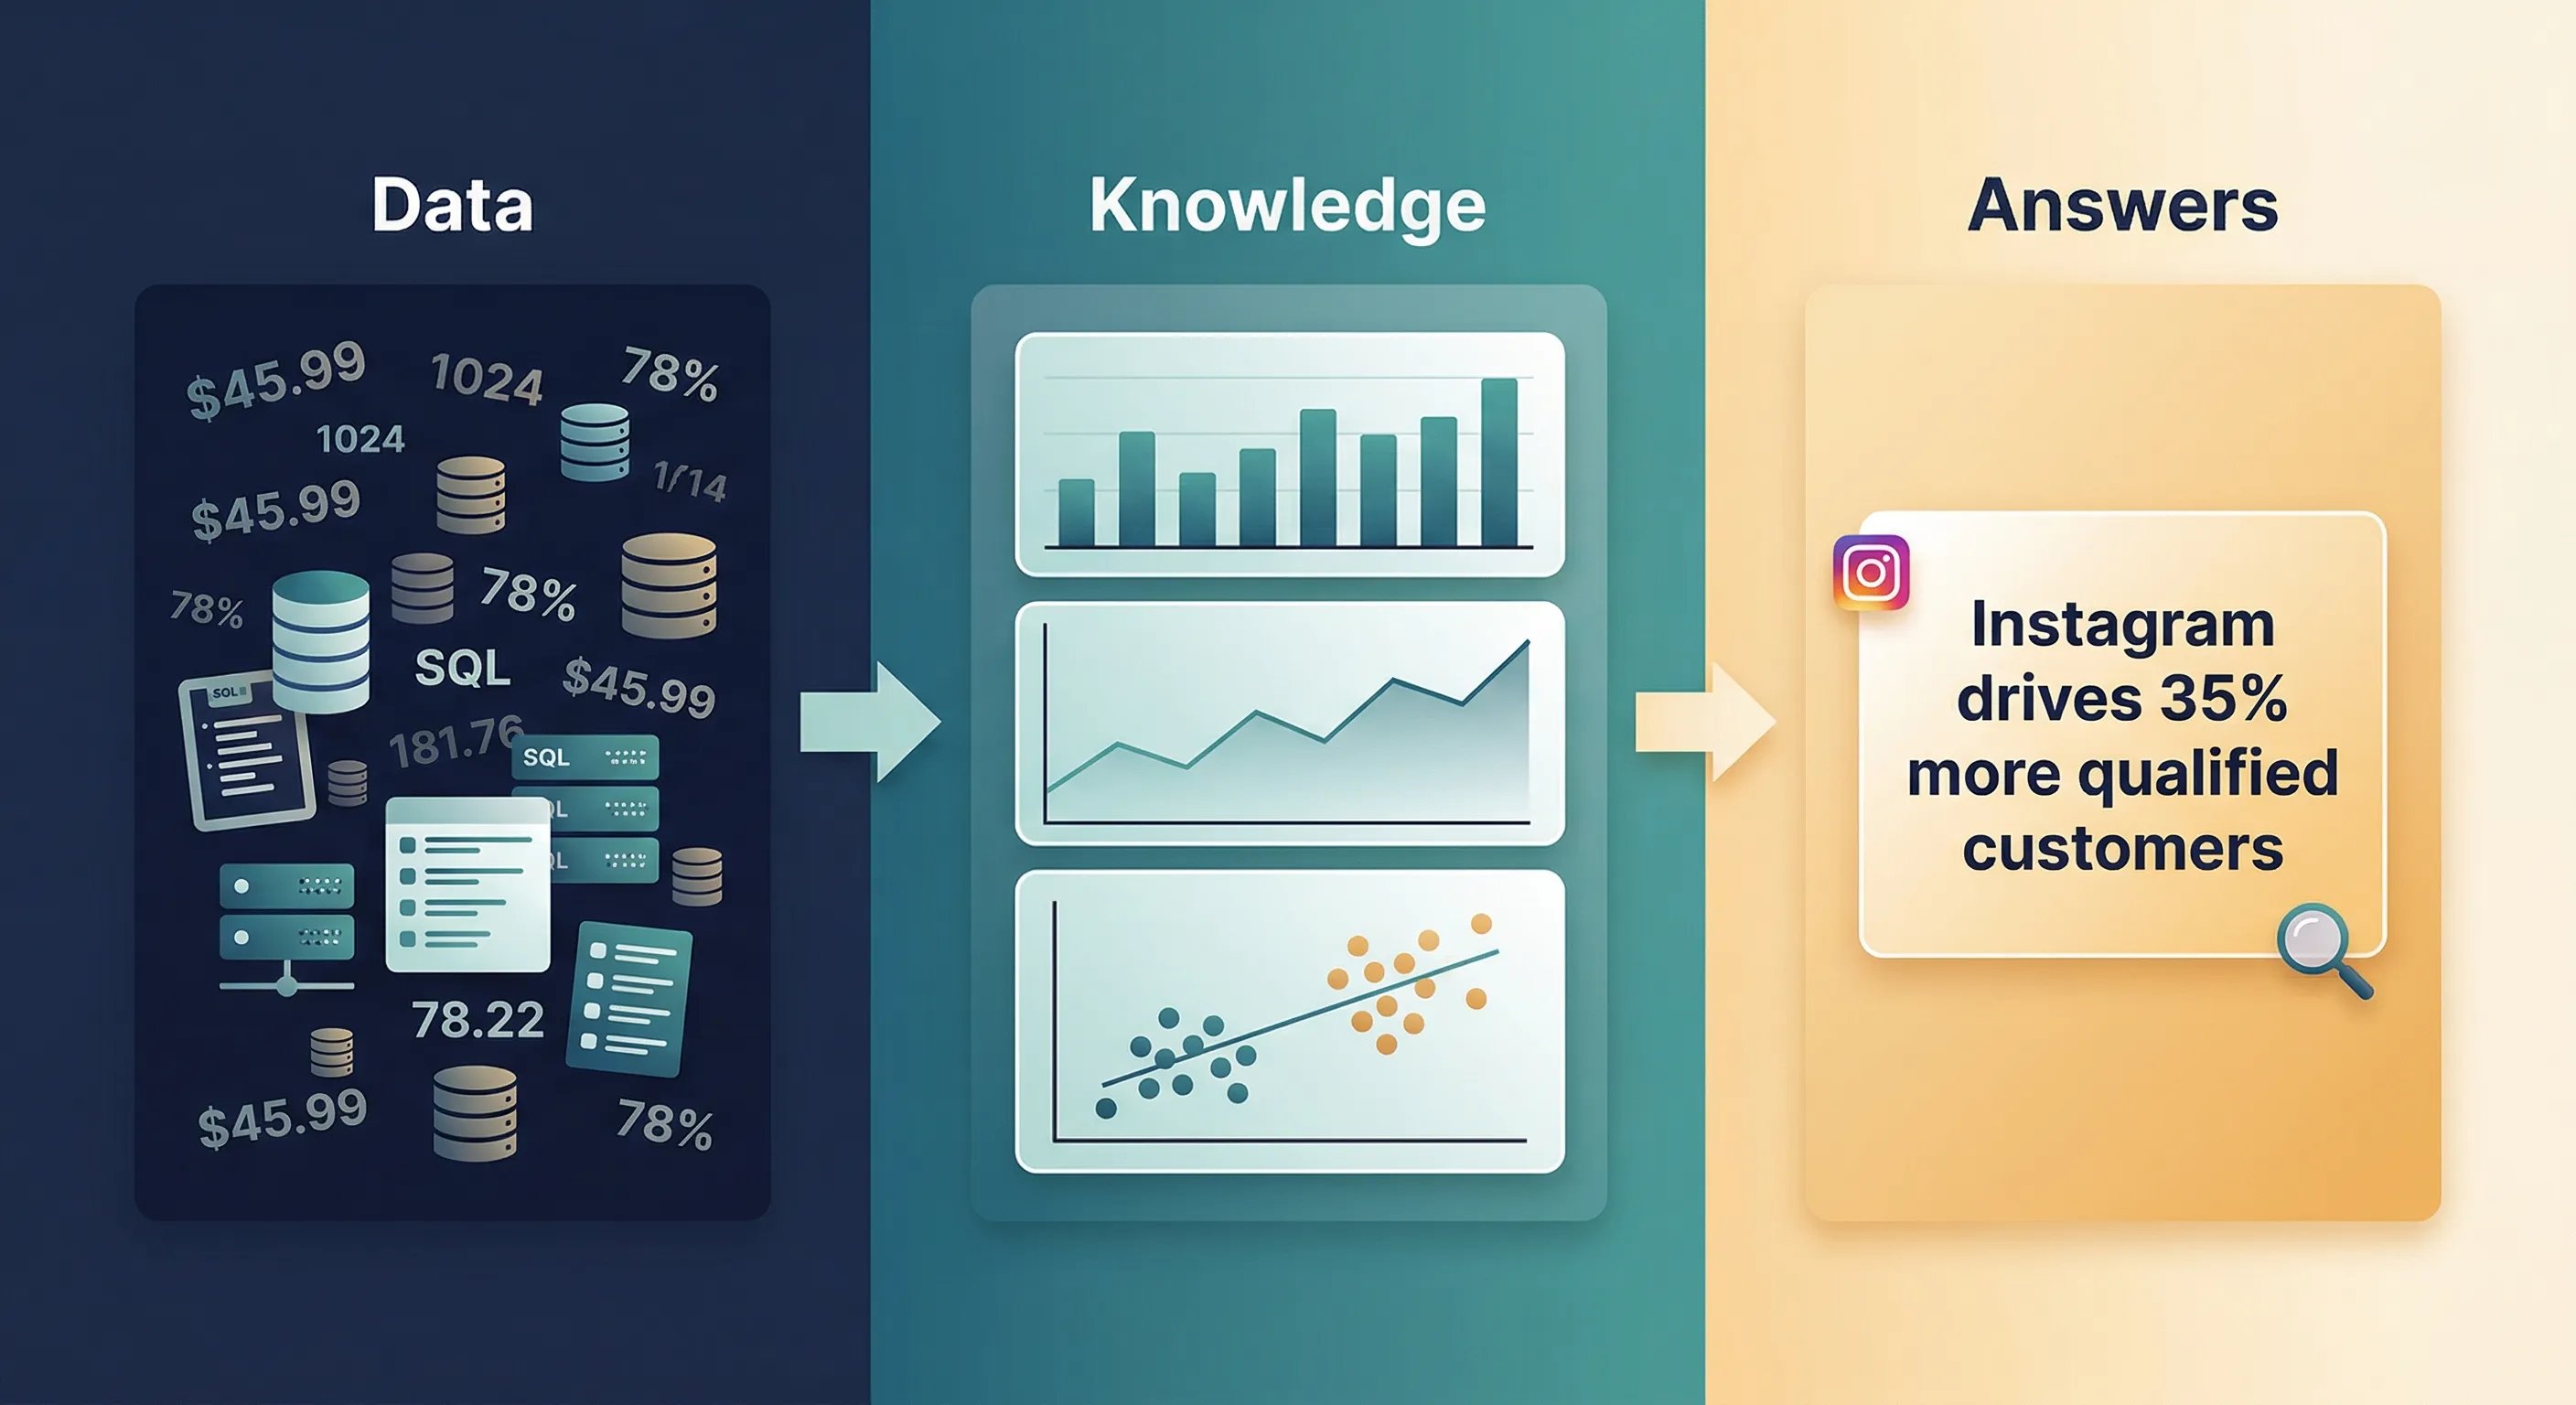
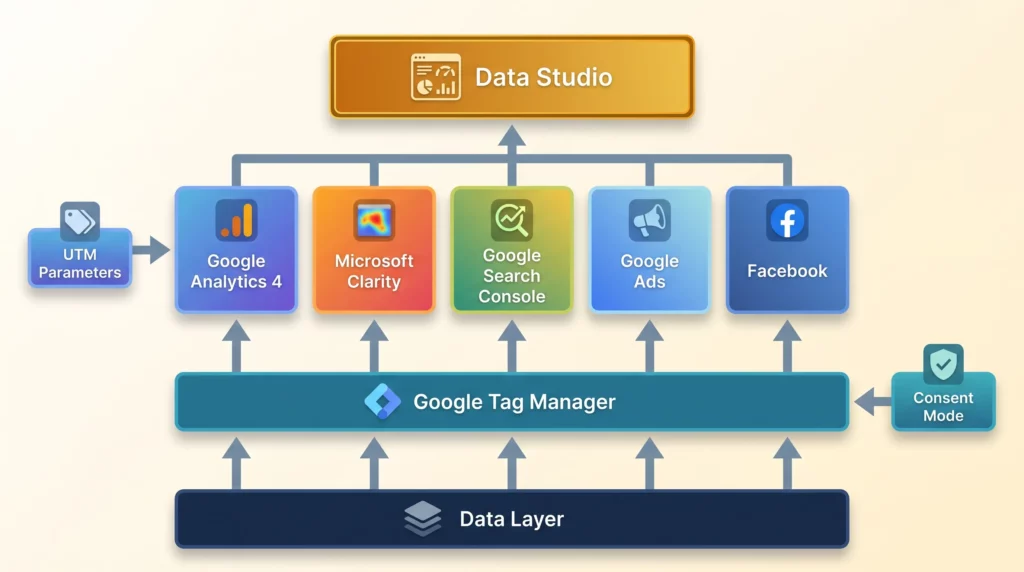
Now we reach the core of the Marketing Measurement Foundation. Answers ← Knowledge ← Data (AnD) is the process of transforming raw data into actionable answers that drive business decisions.
This section covers what you need to implement to build your foundation. Each tool exists because it is involved in answering specific questions from the framework above. Some tools are preferred implementation methods (like GTM), while others may not always be available in every situation. Some tools serve multiple purposes, tracking mechanisms that also provide analysis capabilities.
What matters is understanding what each tool does, why it’s part of the foundation, and how it helps answer your business questions.
Primary Source of Truth: The Data Layer
What It Does:
The Data Layer is a structured communication protocol that acts as a bridge between your website and your marketing tools. It’s the preferred source for tracking data because it provides clean, consistent, structured information that doesn’t break when your website changes.
Why It Matters:
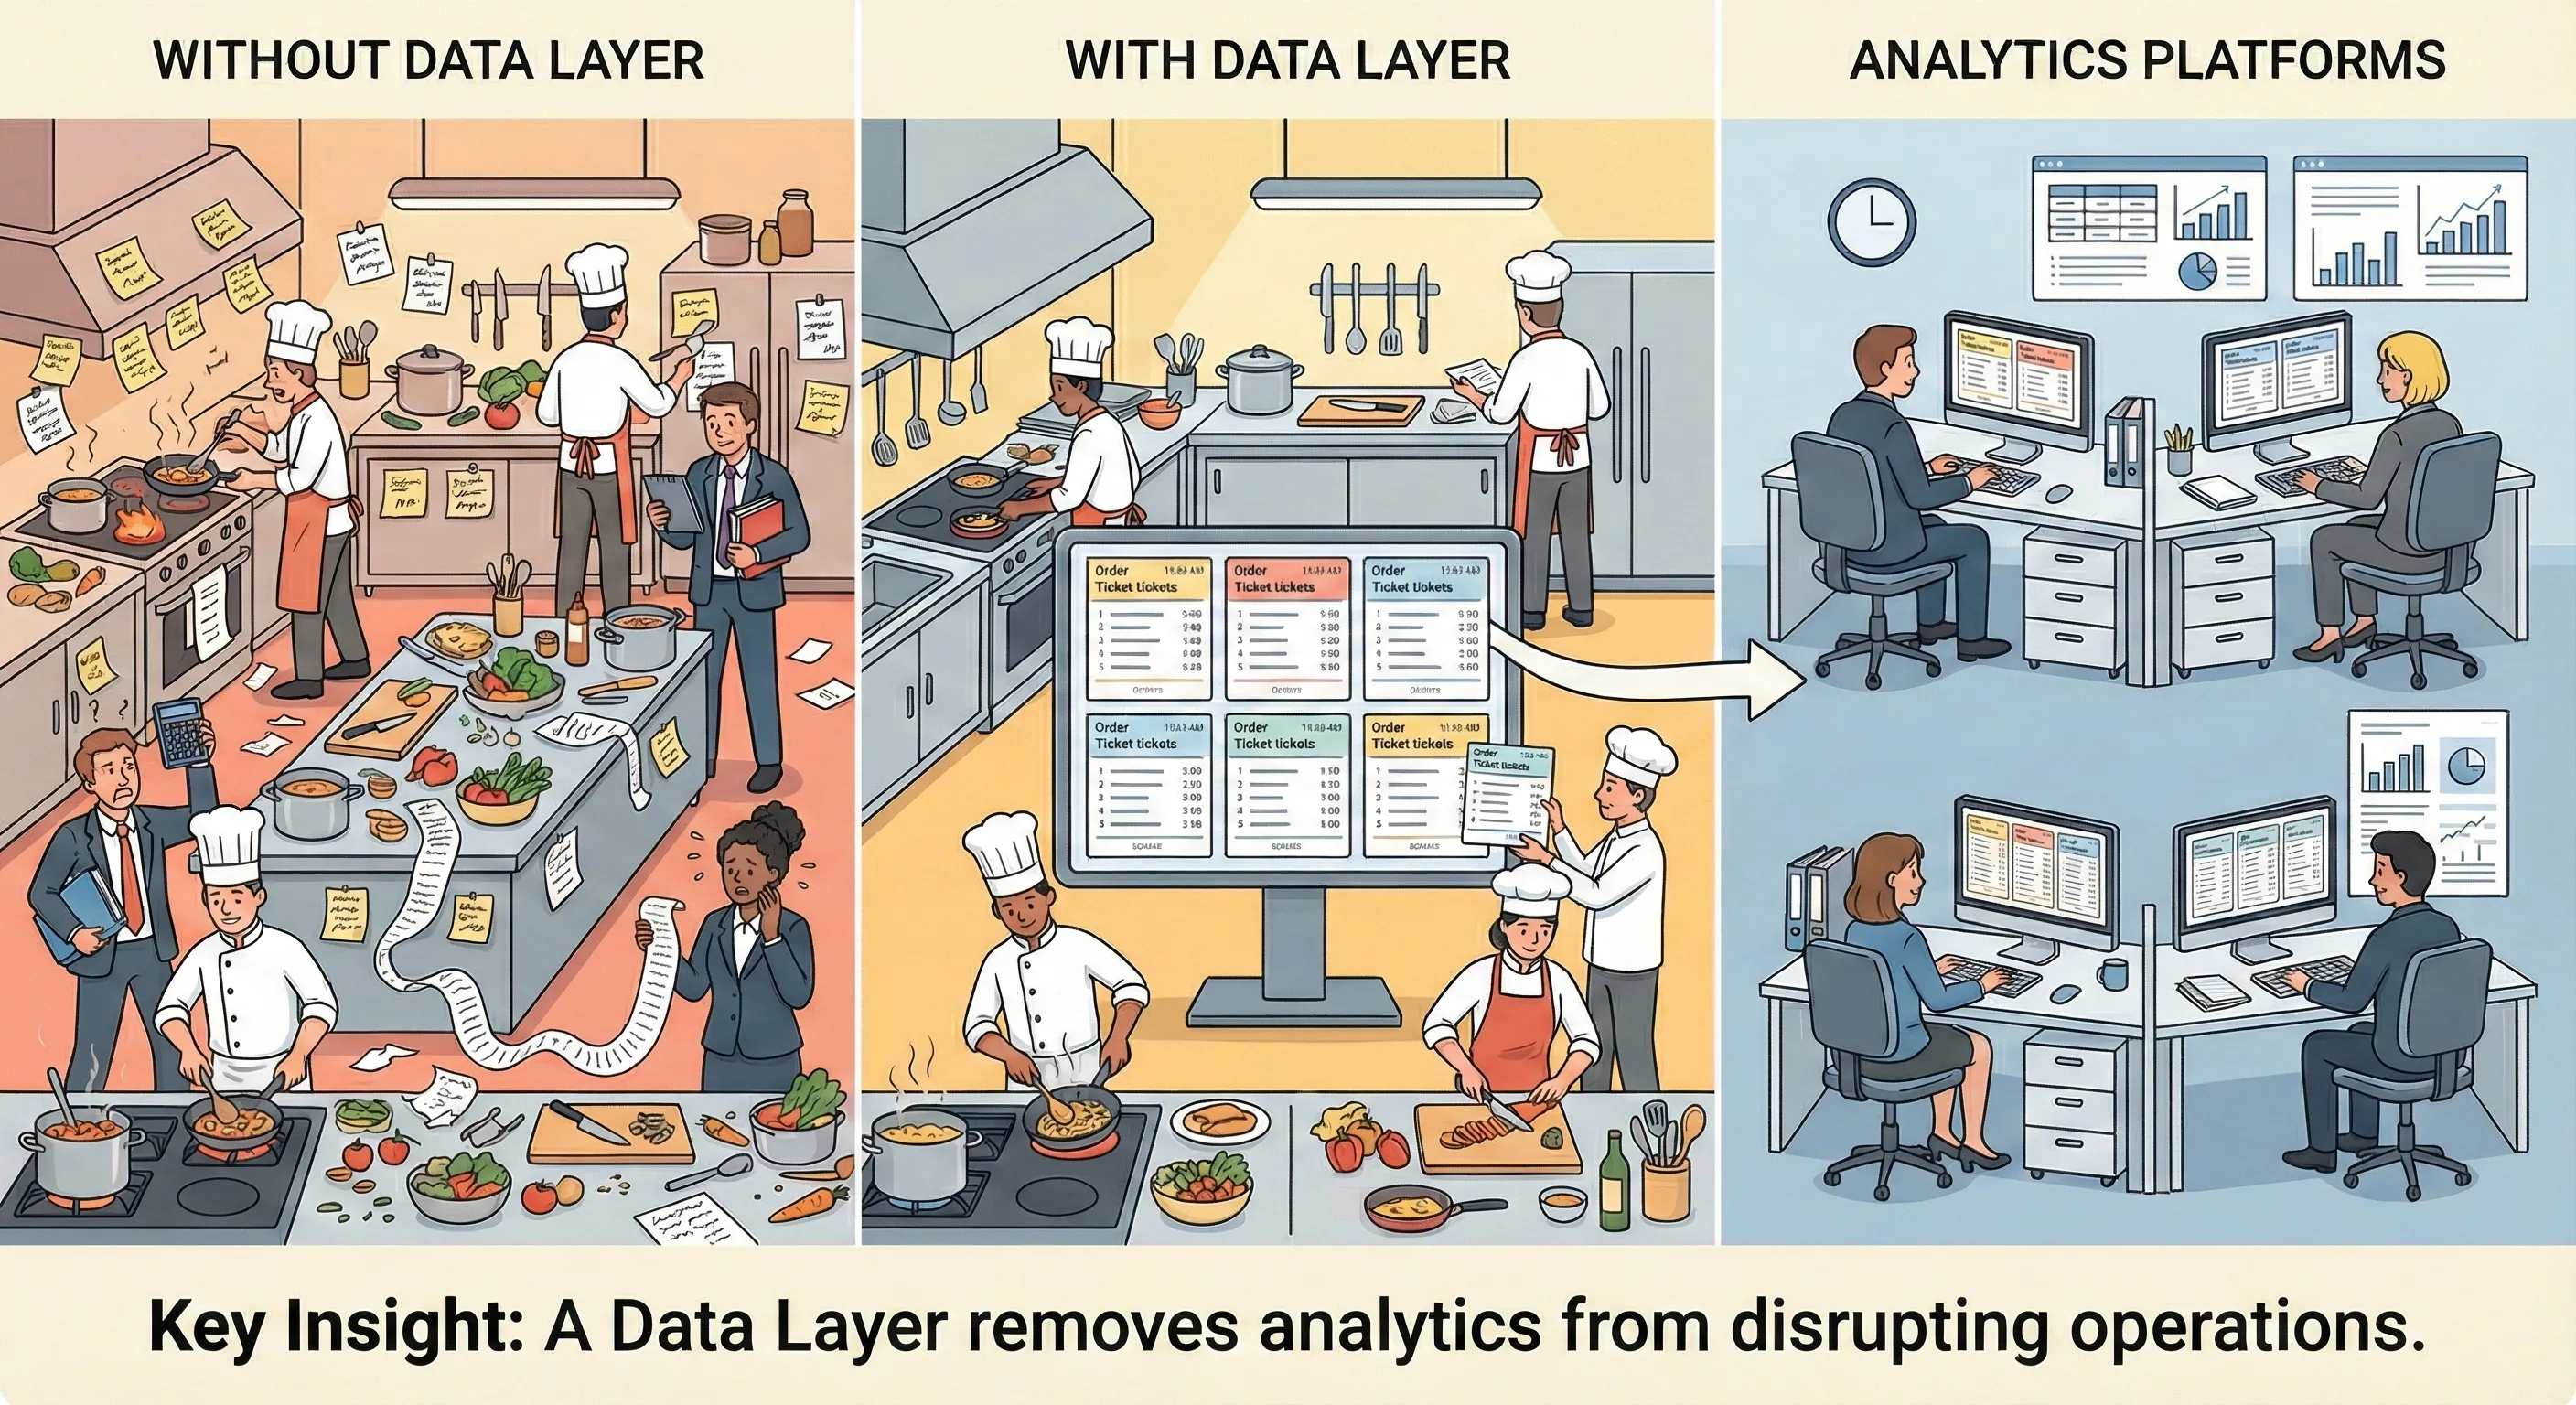
Imagine your website is a busy restaurant kitchen. The kitchen is chaotic (chefs shouting orders, pans sizzling, ingredients flying everywhere). Complex processes happen continuously, but it’s messy and hot.
Your marketing and analytics platforms are like accountants in the back office who need precise records of every transaction to understand business performance. They need to know: What was ordered? What was the price? Was payment successful?
The old approach was sending those accountants into the kitchen to gather information themselves. They’d need to read handwritten notes stuck to walls, count ingredients on shelves, and ask busy chefs for details mid-service.
This creates several problems. First, the information they gather is inconsistent. One accountant might record “Steak Frites” while another writes “Beef with Chips.” Second, they disrupt operations by getting in the way. Third, if the chef changes where they write notes or reorganises ingredients, the accountants can’t find information anymore and data collection silently fails.
The Data Layer establishes a standardised process. For every important event (order placed, payment processed), kitchen staff place a clear, structured ticket on a central communication hub:
{
  "event": "order_placed",
  "table_number": 14,
  "item": "Steak Frites",
  "amount": 25.50
}Now accountants collect these standardised tickets and have a perfect, reliable record. They don’t need to enter the kitchen, interpret handwritten notes, or guess at missing information. The data is clean, consistent, and structured.
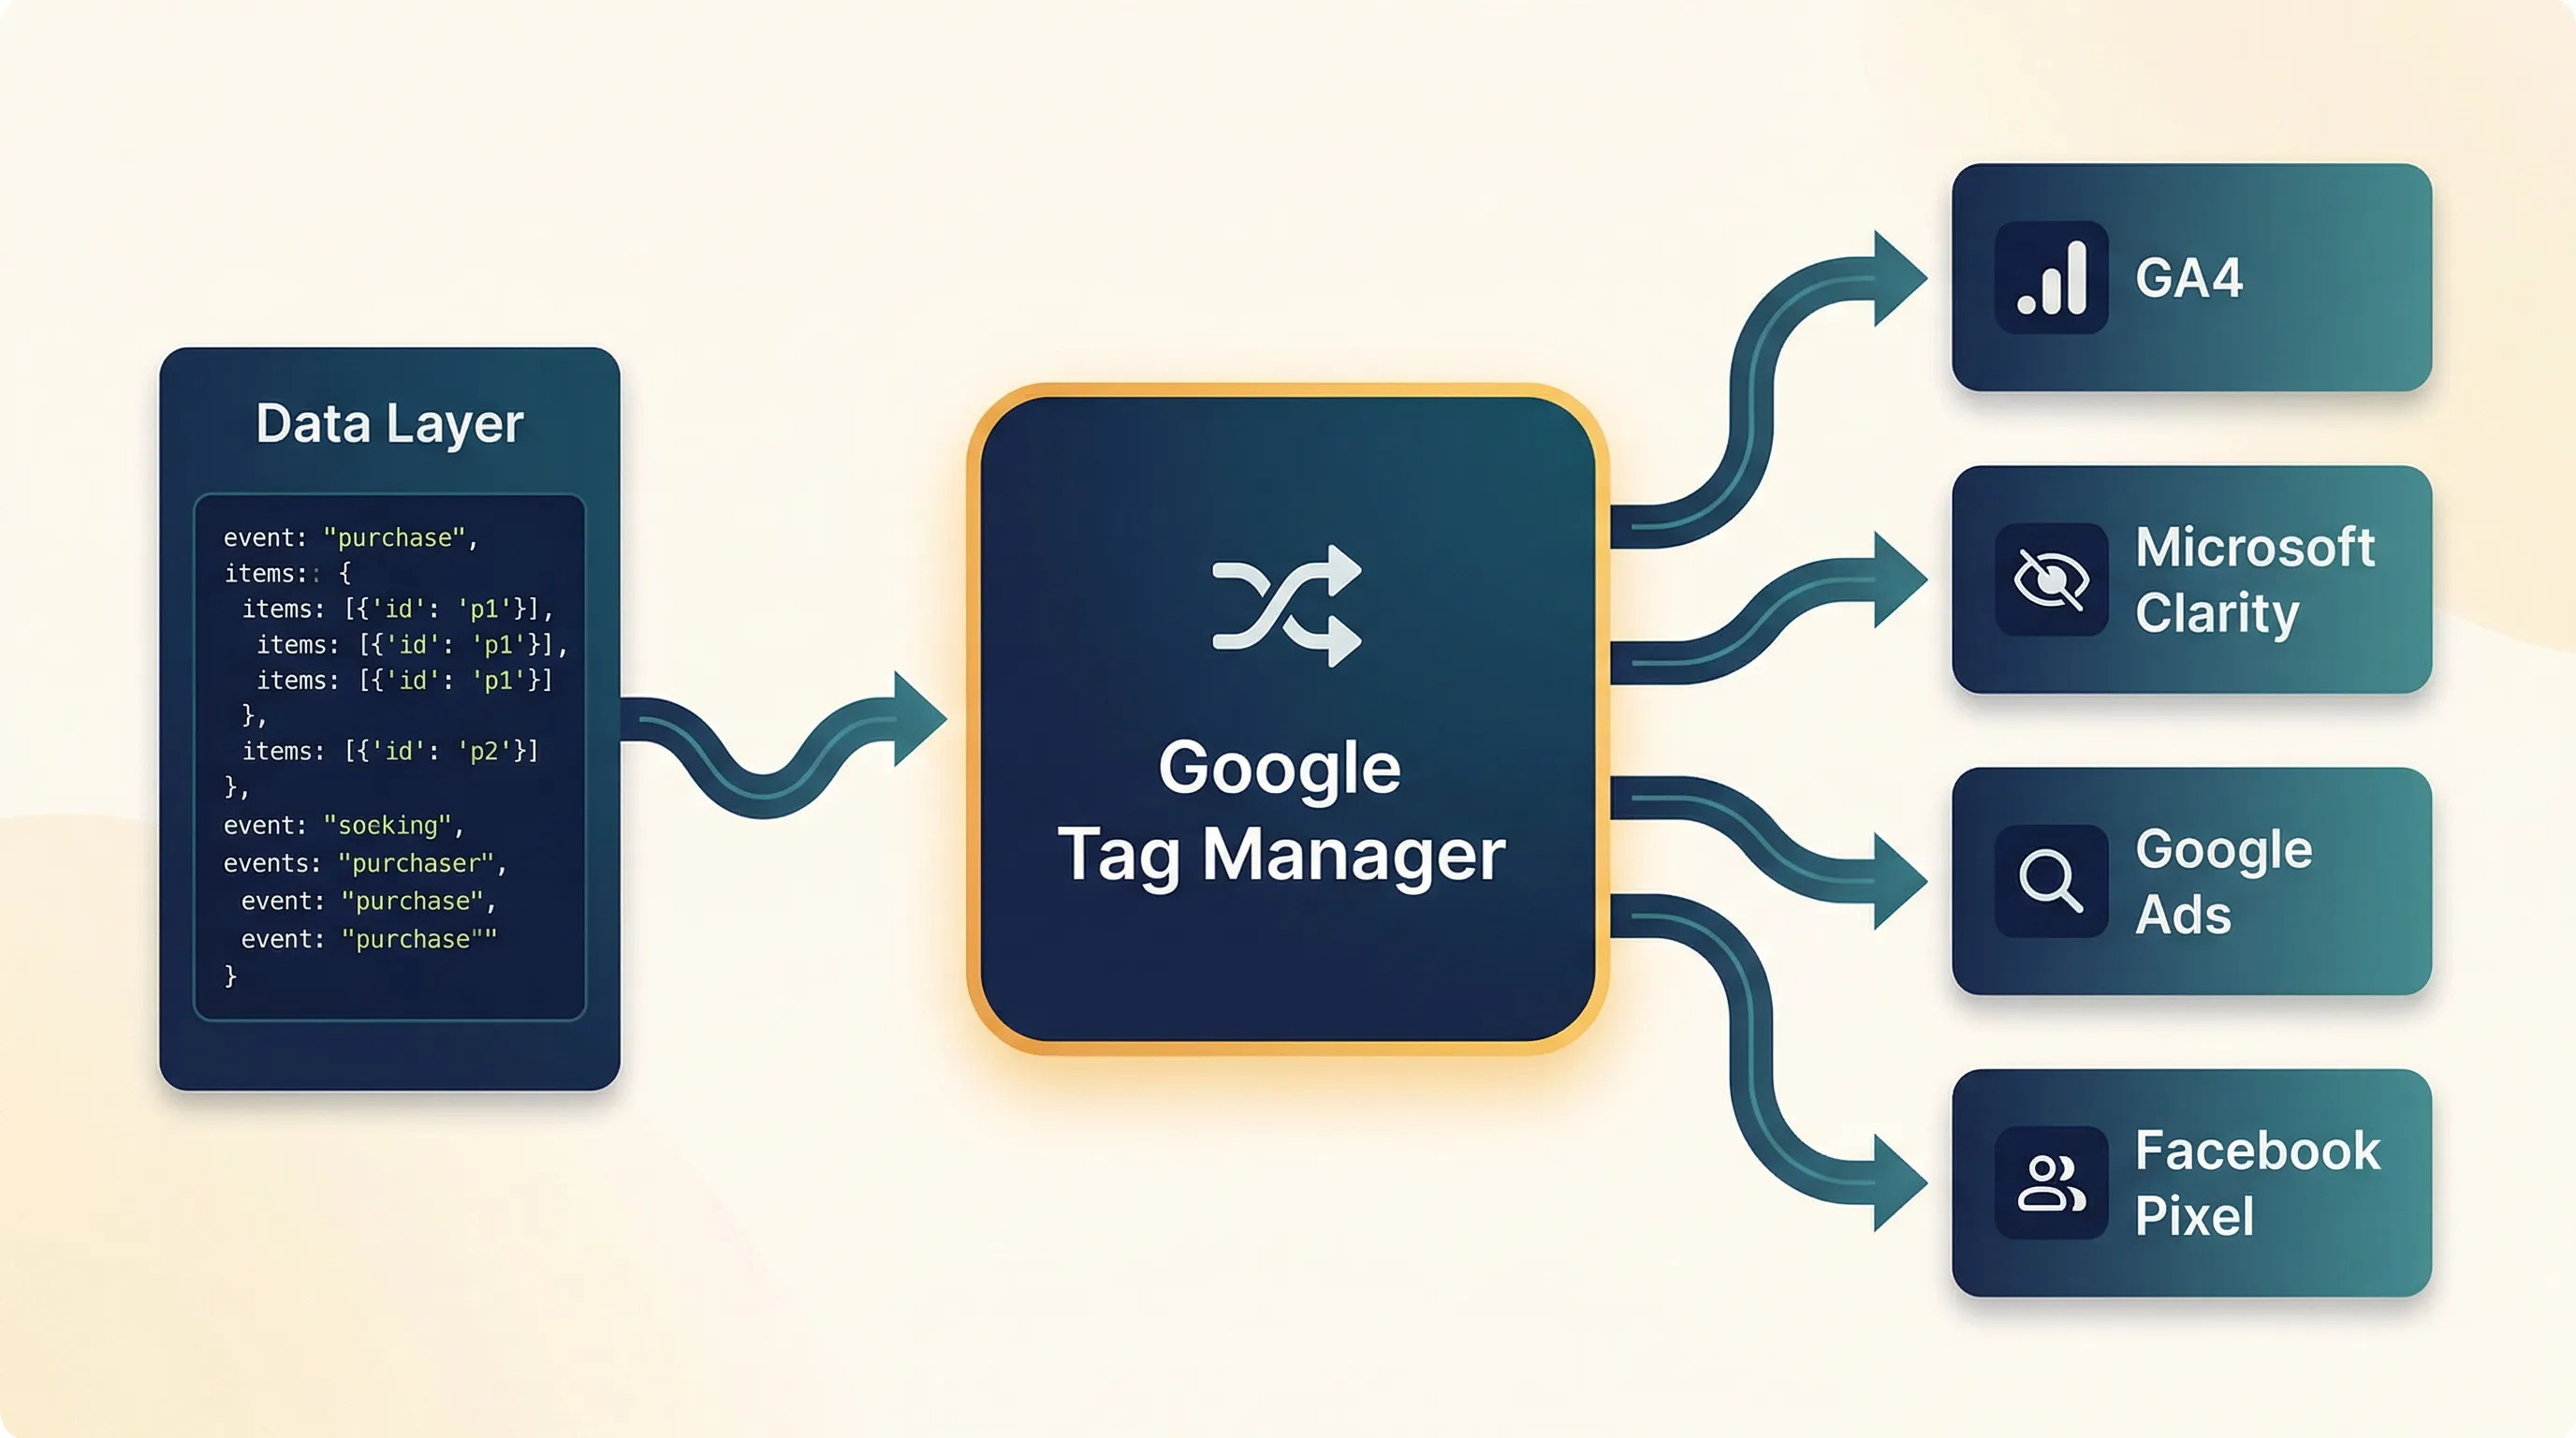
In technical terms, the Data Layer is a JavaScript Array with some conventions on how it is used. When a user completes a purchase, your website code pushes structured information into the Data Layer. Google Tag Manager monitors this Data Layer and reacts instantly, sending relevant information to GA4, Facebook Pixel, Google Ads, and any other connected service.
The critical advantage: when your website speaks one language (HTML, databases, internal code) and marketing tools speak another (event parameters, JSON, API calls), the Data Layer acts as a universal translator. This ensures consistency, you won’t have Facebook receive a $50 sale while GA4 receive a $49 sale because both platforms receive identical, structured data from the same source. The key point is that they get the same data. There will still be some differences on how they report due to differences in their underlaying data model.
Without the Data Layer, tracking relies on “DOM scraping”, targeting visual elements like “the red button” or “the div with class buy-now.” This is fragile. If a developer changes the button colour or CSS class name during a site redesign, your tracking breaks instantly and the business becomes blind without warning.
Important Note: The Data Layer may not always be available in your specific situation, particularly if you’re using a platform with limited code access or relying on third-party integrations that don’t support it. When available, it’s the preferred approach for reliable tracking.
How It Fits:
The Data Layer is the structured communication protocol that other tools depend on. When you implement behaviour tracking, those events get pushed to the Data Layer. When you implement attribution tags, they attach to Data Layer events. When platforms need data, they read from the Data Layer.
The Data Layer for Marketing Measurement Foundation is based on GA4 events (form tracking, ecommerce, lead generation, etc).
The Data Layer was created to establish a single source of truth for website behaviour tracking. It therefore can be used by many marketing tools. The tool we will be using for the Measurement Marketing Foundation is Google Tag Manager.
Implementation:
If want want to learn more details see our guide on Using the Data Layer with Google Tag Manager.
Google Tag Manager
What It Does:
Google Tag Manager is a deployment system that allows you to add, modify, and manage all your tracking codes without constantly needing a developer. It’s the preferred implementation method for all tracking across all platforms.
Think of your business outcomes as your destination. When you’re driving, you monitor progress by looking at the dashboard. The speedometer shows current speed, the fuel gauge shows remaining fuel, and the odometer shows distance travelled.
But you don’t drive by looking at what’s under the hood. Under the bonnet is a sophisticated engine management system (a complex network of wires and sensors connecting everything from the fuel injector to the speedometer). This system ensures the right information reaches the dashboard at the right time.
Google Tag Manager is that engine management system for your website. It’s the infrastructure that collects data from user behaviours and sends it to your analytics platforms. You don’t interact with it daily, and you don’t need to understand every technical detail. But without it, your dashboard would be blank.
Here’s the critical connection: GTM monitors your Data Layer. When structured events are pushed to the Data Layer (like the restaurant kitchen tickets we discussed earlier), GTM detects them instantly and executes the appropriate tracking tags. The Data Layer provides the clean, structured data. GTM provides the mechanism to route that data to the right platforms. This separation is what makes the foundation maintainable, you can change which platforms receive data or how tags are configured without touching your website’s core code or the Data Layer structure.
Why It Matters:
Historically, businesses implemented tracking by hardcoding scripts directly into their website’s HTML. This created critical problems.
When tracking code is tightly coupled with your website’s structure, any design change could silently break tracking. If a developer changes a button’s ID that your tracking script references, data collection stops and you won’t realise until you notice suspicious patterns in reports.
Hardcoding also creates bottlenecks. Every tracking modification requires developer intervention. Marketing waits for IT, and by the time changes are deployed, market conditions have shifted.
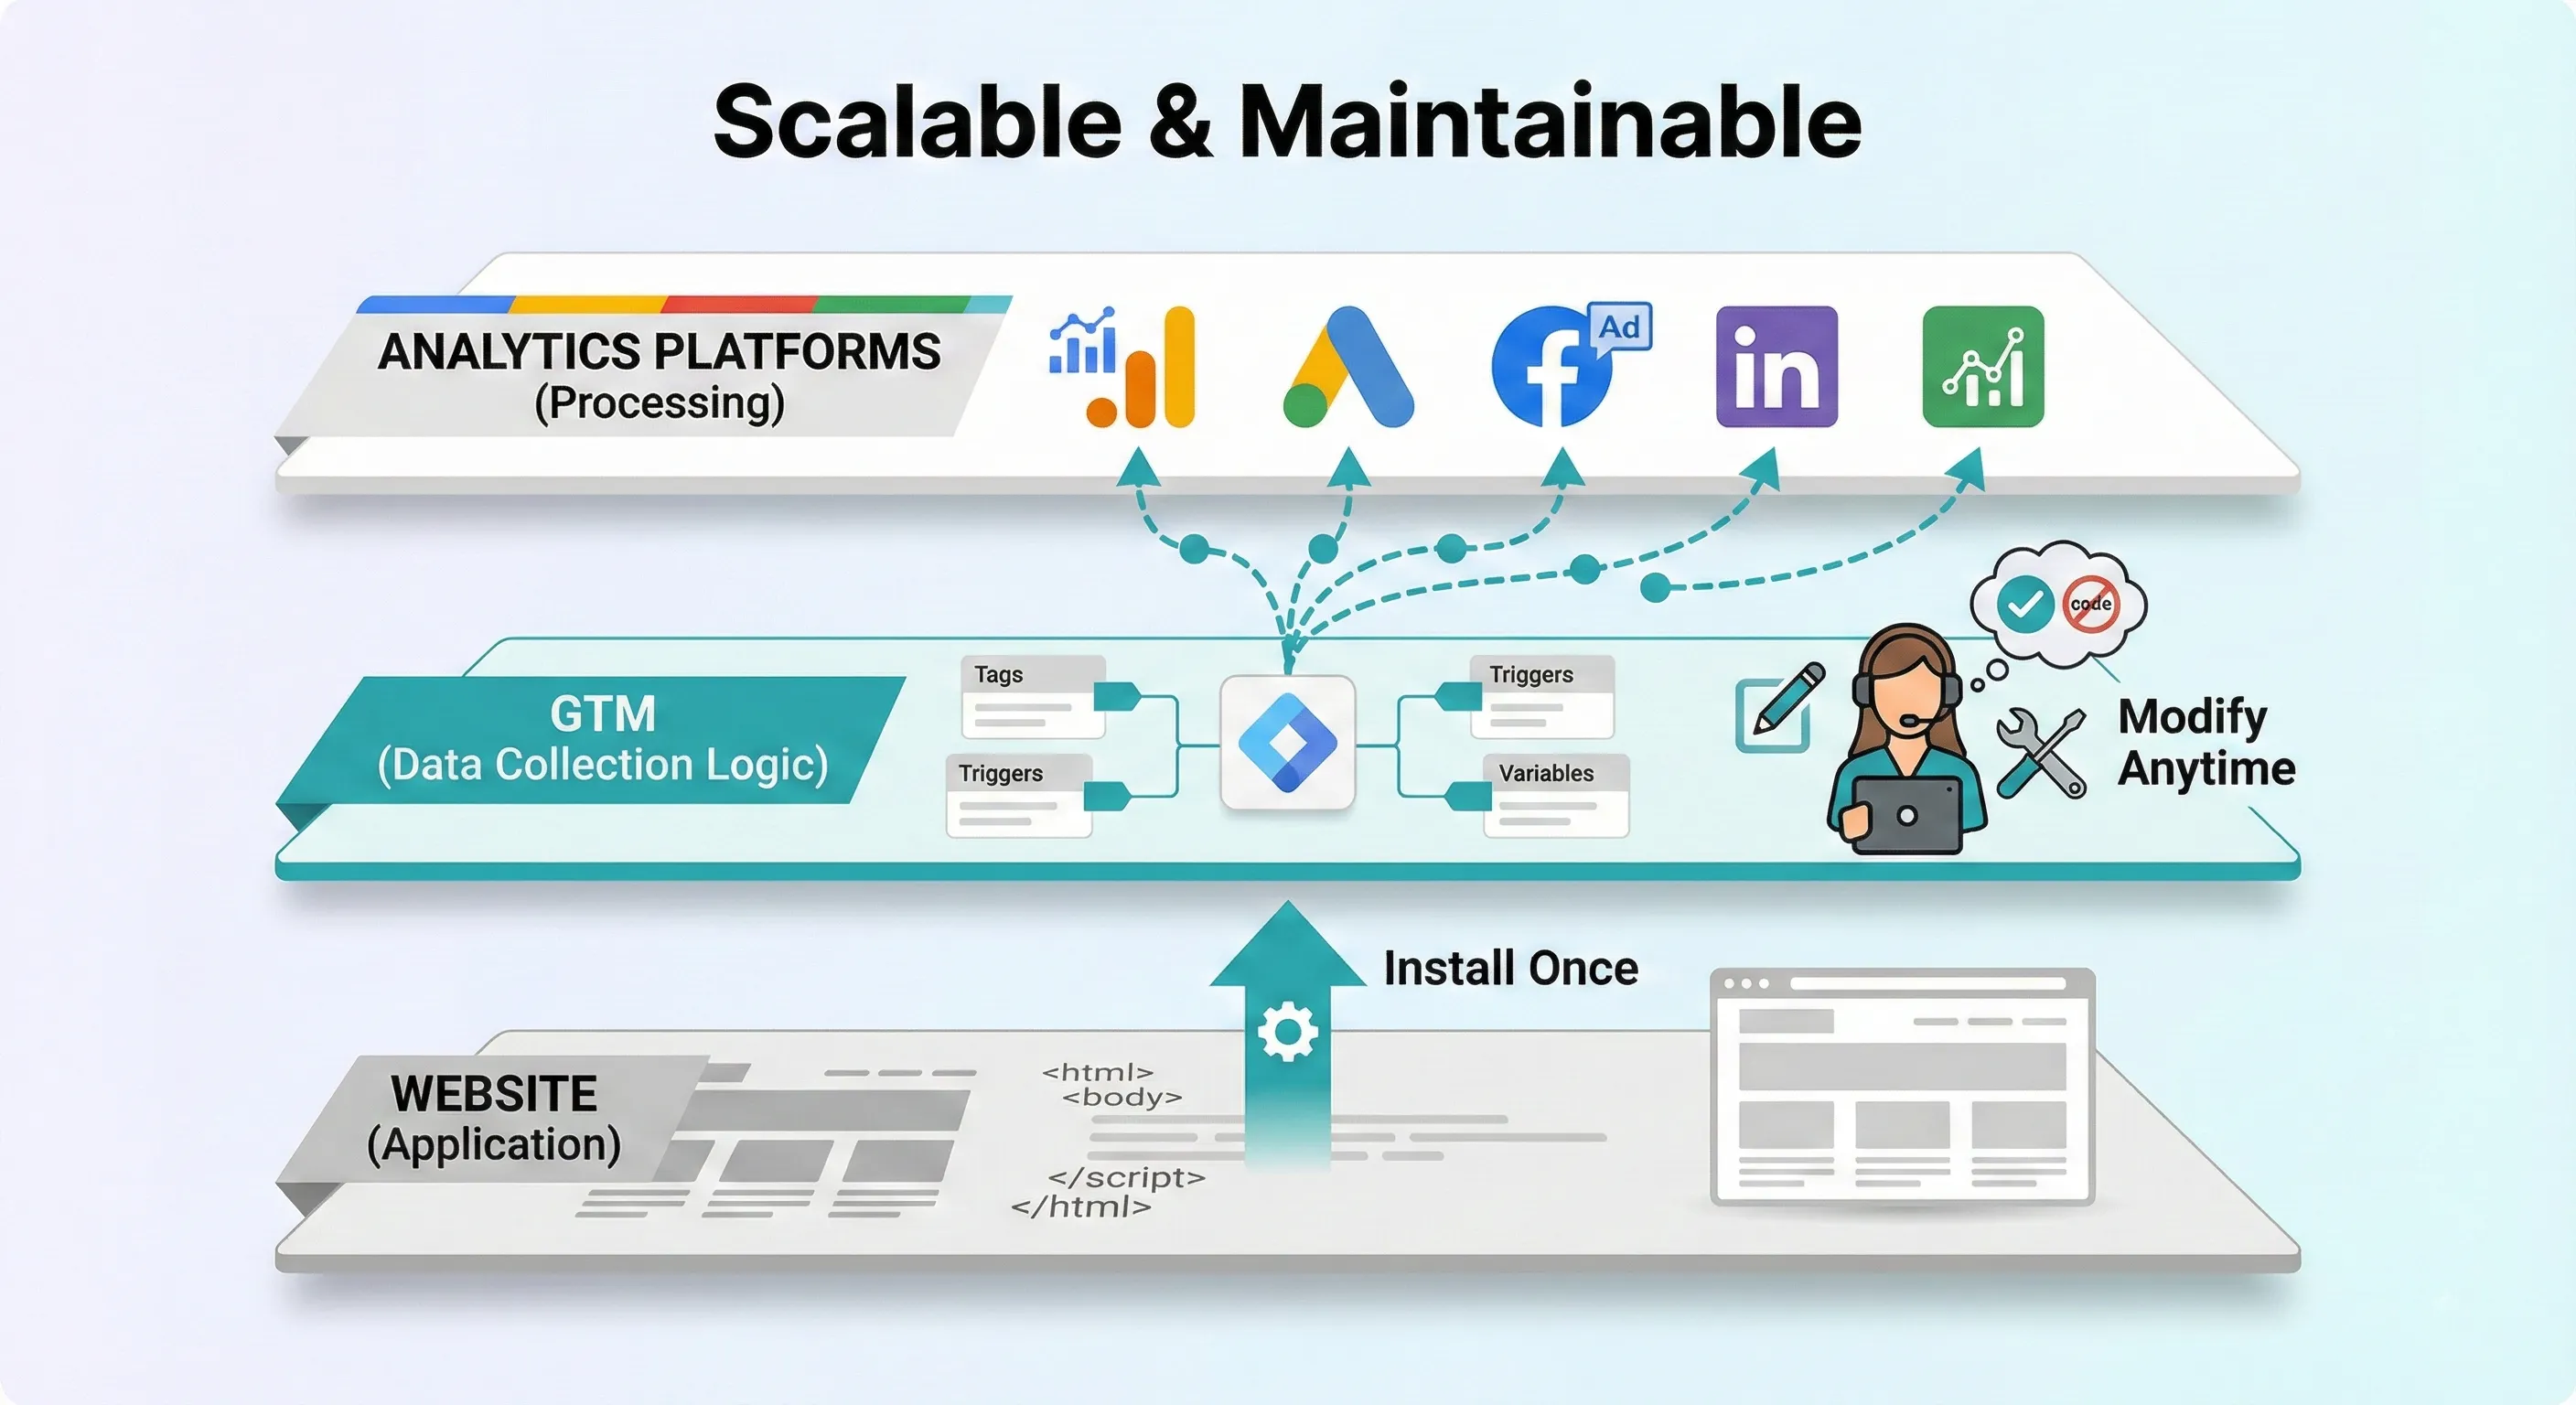
Google Tag Manager solves these issues through the “Separated Stack” architecture. You install GTM once. From that point forward, marketers can deploy and modify tracking codes through a user-friendly interface without touching website source code. This separation between your website (the application), your data collection logic (GTM), and your analytics processing makes the foundation scalable and maintainable.
Important Note: While GTM is the preferred implementation method, it may not always be available depending on your platform, technical constraints, or existing infrastructure. Some platforms have their own tag management systems or require direct code implementation.
How It Fits:
GTM is the deployment mechanism that bridges your Data Layer and your analytics platforms. It monitors the Data Layer for events, then executes the appropriate tags to send that data to GA4, Clarity, ad platforms, and other destinations. This is why the Data Layer and GTM work together as the foundation: the Data Layer structures the data, and GTM routes it. When you implement behaviour tracking, those events get pushed to the Data Layer, and GTM tags fire in response. When you implement conversion tracking, GTM sends those conversion signals to your platforms based on Data Layer events. When you implement attribution, the UTM parameters flow through this same Data Layer → GTM → Platform pipeline.
Implementation:
For detailed implementation instructions, see our guide on How to Install Google Tag Manager.
What Behaviours Happened: Google Analytics 4
What It Does:
Google Analytics 4 serves a dual purpose in the foundation. First, it’s the mechanism for tracking behaviours through events. Second, it’s the central analytics hub that processes those events and provides visibility across all your marketing channels.
Every user interaction (behaviour) you want to measure is captured as an “event” with a specific name and parameters (required or optional). When someone clicks “Add to Cart,” that’s an event. When they submit a contact form, that’s an event. When they watch a product video, that’s an event. Each event represents a discrete behaviour you’ve decided matters for your business.
The Event Foundation:
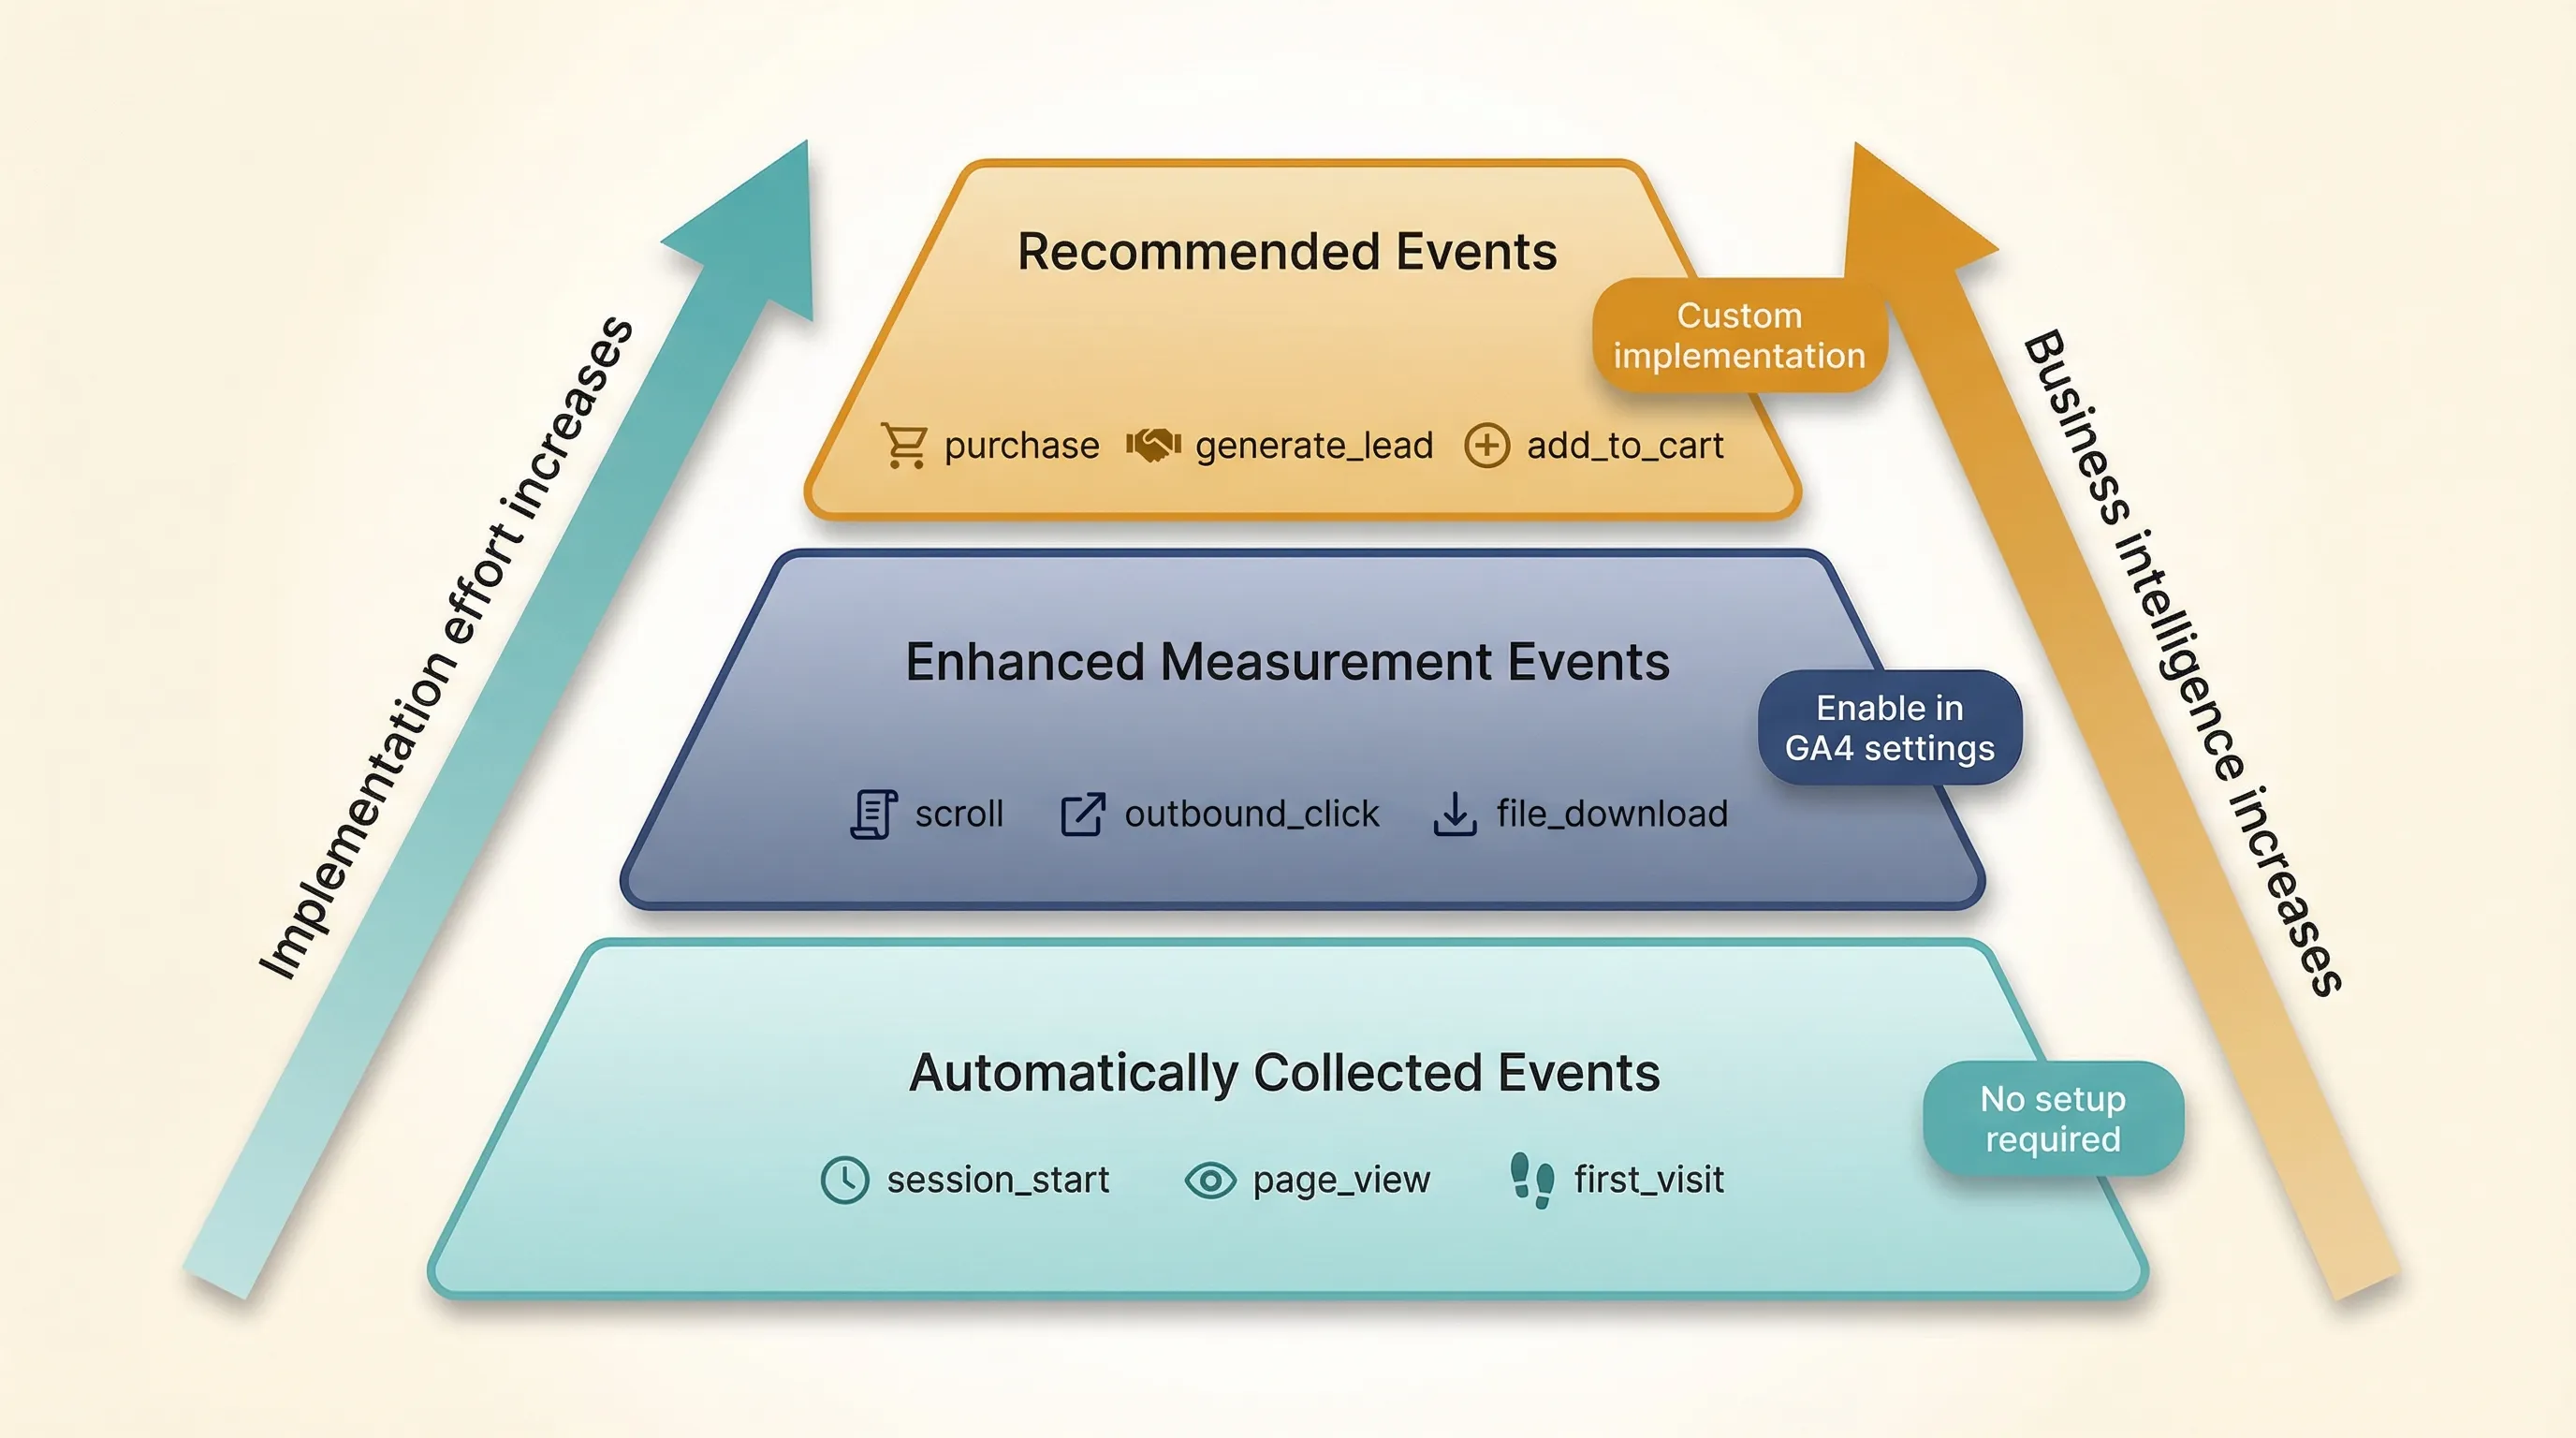
The foundation focuses on three types of events that provide essential business intelligence:
Automatically Collected Events: These track basic site functionality automatically once GA4 is installed: session_start, first_visit, page_view, user_engagement. They provide baseline data about site usage without any configuration.
Enhanced Measurement Events: These track common interactions automatically when enabled: scroll (90% depth), outbound_click, site_search, video_engagement, file_download. They capture standard engagement behaviours without custom implementation.
Recommended Events: These are standardised event names for common business actions that require specific implementation. For ecommerce: purchase, add_to_cart, view_item, begin_checkout. For lead generation: generate_lead, sign_up.
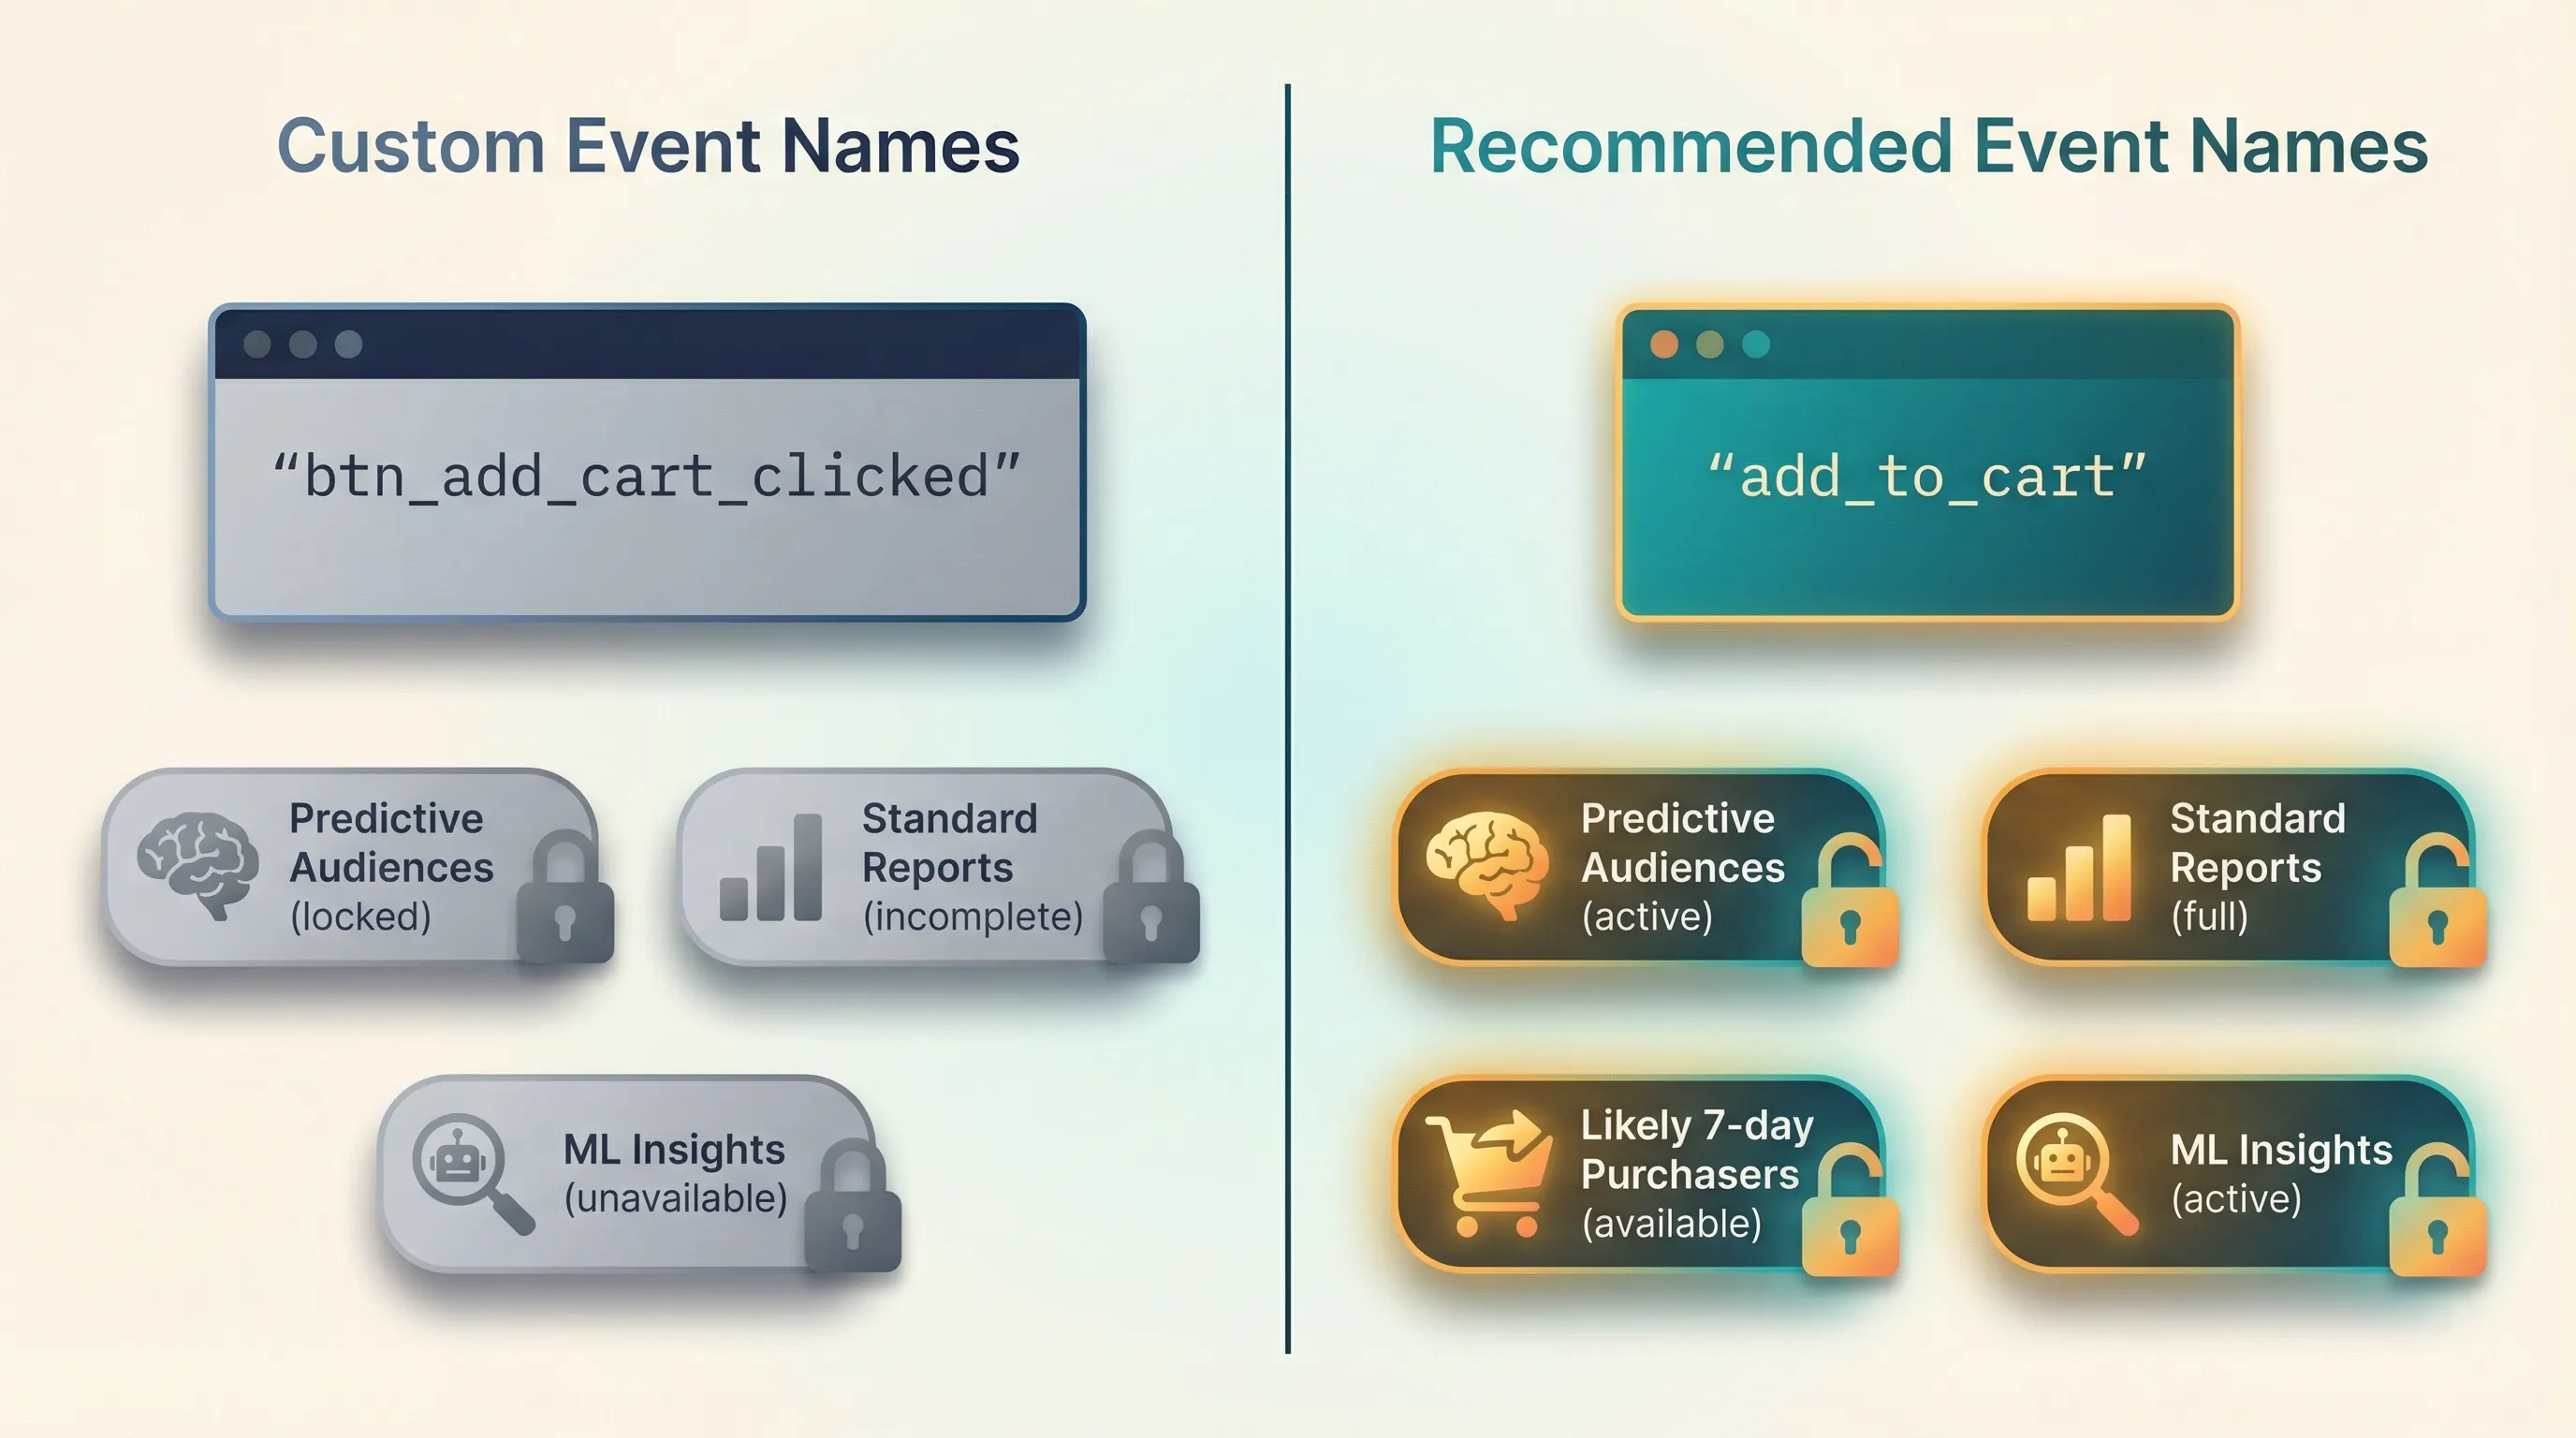
Using Google’s recommended event names is critical. They are required to populate the Standard Reports. Also, Google’s machine learning models recognise these standardised events and can create predictive audiences, automatically identifying users with high purchase probability or churn risk. Using custom event names means you lose access to these predictive features.
Why It Matters:
Without proper event implementation, you only see page views. You can’t answer questions like Which product categories drive the most engagement? or Where do users abandon the checkout flow? or Which content keeps visitors on site longest?
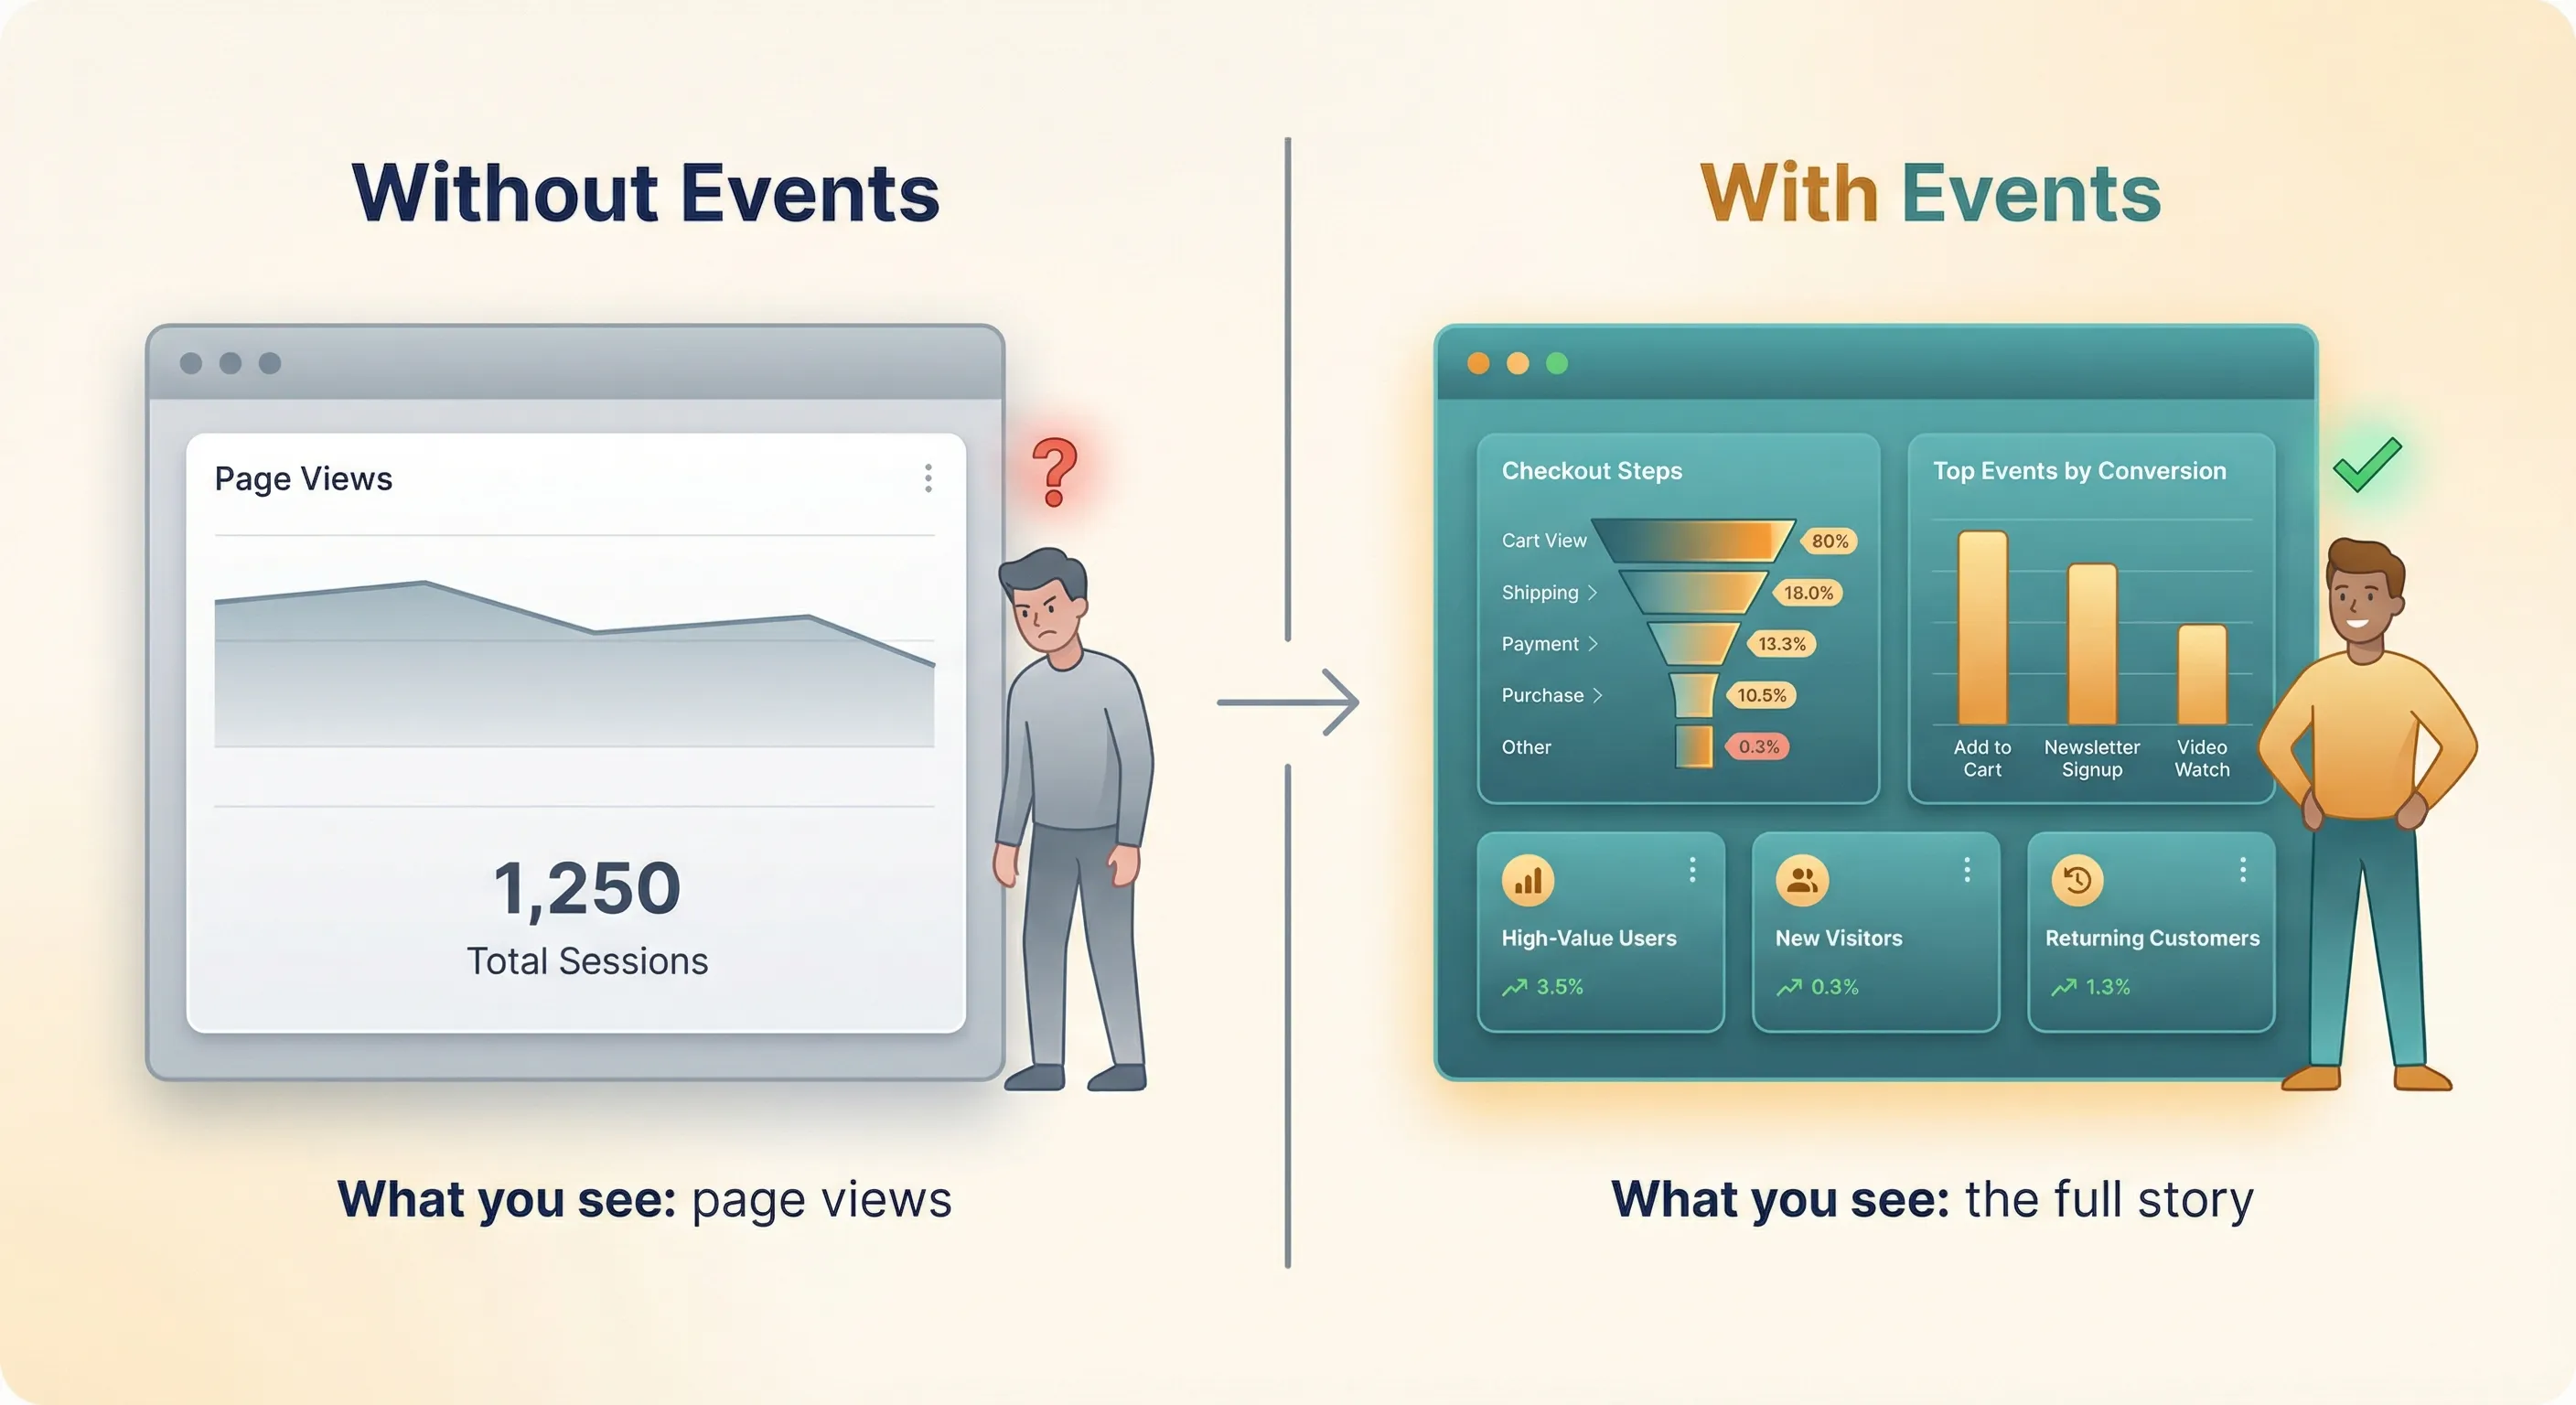
Events transform your website from a black box into an instrumented environment where every meaningful behaviour is measurable. This visibility across all marketing channels (organic search, paid ads, social media, email, direct traffic) allows you to answer your critical attribution and efficiency questions.
Beyond event tracking, GA4 aggregates individual events into sessions and user journeys. It calculates metrics like conversion rates, average order values, and customer lifetime value. It builds audiences based on user behaviours. It applies machine learning to predict future actions and identify high-value users.
Important Note: GA4 is preferably implemented via GTM for flexibility and maintainability, but this isn’t always possible. Some platforms require direct installation, and some scenarios benefit from hybrid approaches where certain events use GTM while others use direct implementation.
How It Fits:
GA4 events are the fundamental mechanism for measuring behaviours from the ARC framework. When you implement UTM parameters (which we’ll get to soon), those attribution tags attach to GA4 events. When you implement conversion tracking, you’re marking specific GA4 events as conversions (now called Key Events). When you analyse performance in Looker Studio, much of that data comes from GA4.
Implementation:
To setup up GA4 see our guide on How to Install Google Analytics 4 (GA4) on Your Website. Our guide on “How to Track Events with Google Analytics 4 and Google Tag Manager” is coming soon.
Why Behaviours Happened: Microsoft Clarity
What It Does:
Microsoft Clarity is a user experience (UX) tool that captures and analyses how visitors actually interact with your site. While GA4 events capture discrete actions (clicks, scrolls, submissions), Clarity captures the continuous experience; entire user sessions showing cursor movements, clicks, scrolls, and page interactions in real time.
Think of GA4 events as timestamps of specific moments. Clarity is the full video recording between those moments.
What Gets Captured and Analysed:
Session Recordings: Complete recordings of user sessions showing exactly what visitors see and do. You watch their cursor move, see where they hesitate, observe what they click repeatedly, and identify where they abandon.
Click and Scroll Data: Aggregated data about where users click and how far they scroll, processed into heatmaps for pattern analysis.
Frustration Signals: Clarity automatically identifies “rage clicks” (rapidly clicking an unresponsive element), “dead clicks” (clicking non-interactive elements), and excessive scrolling (looking for something they can’t find).
Why It Matters:
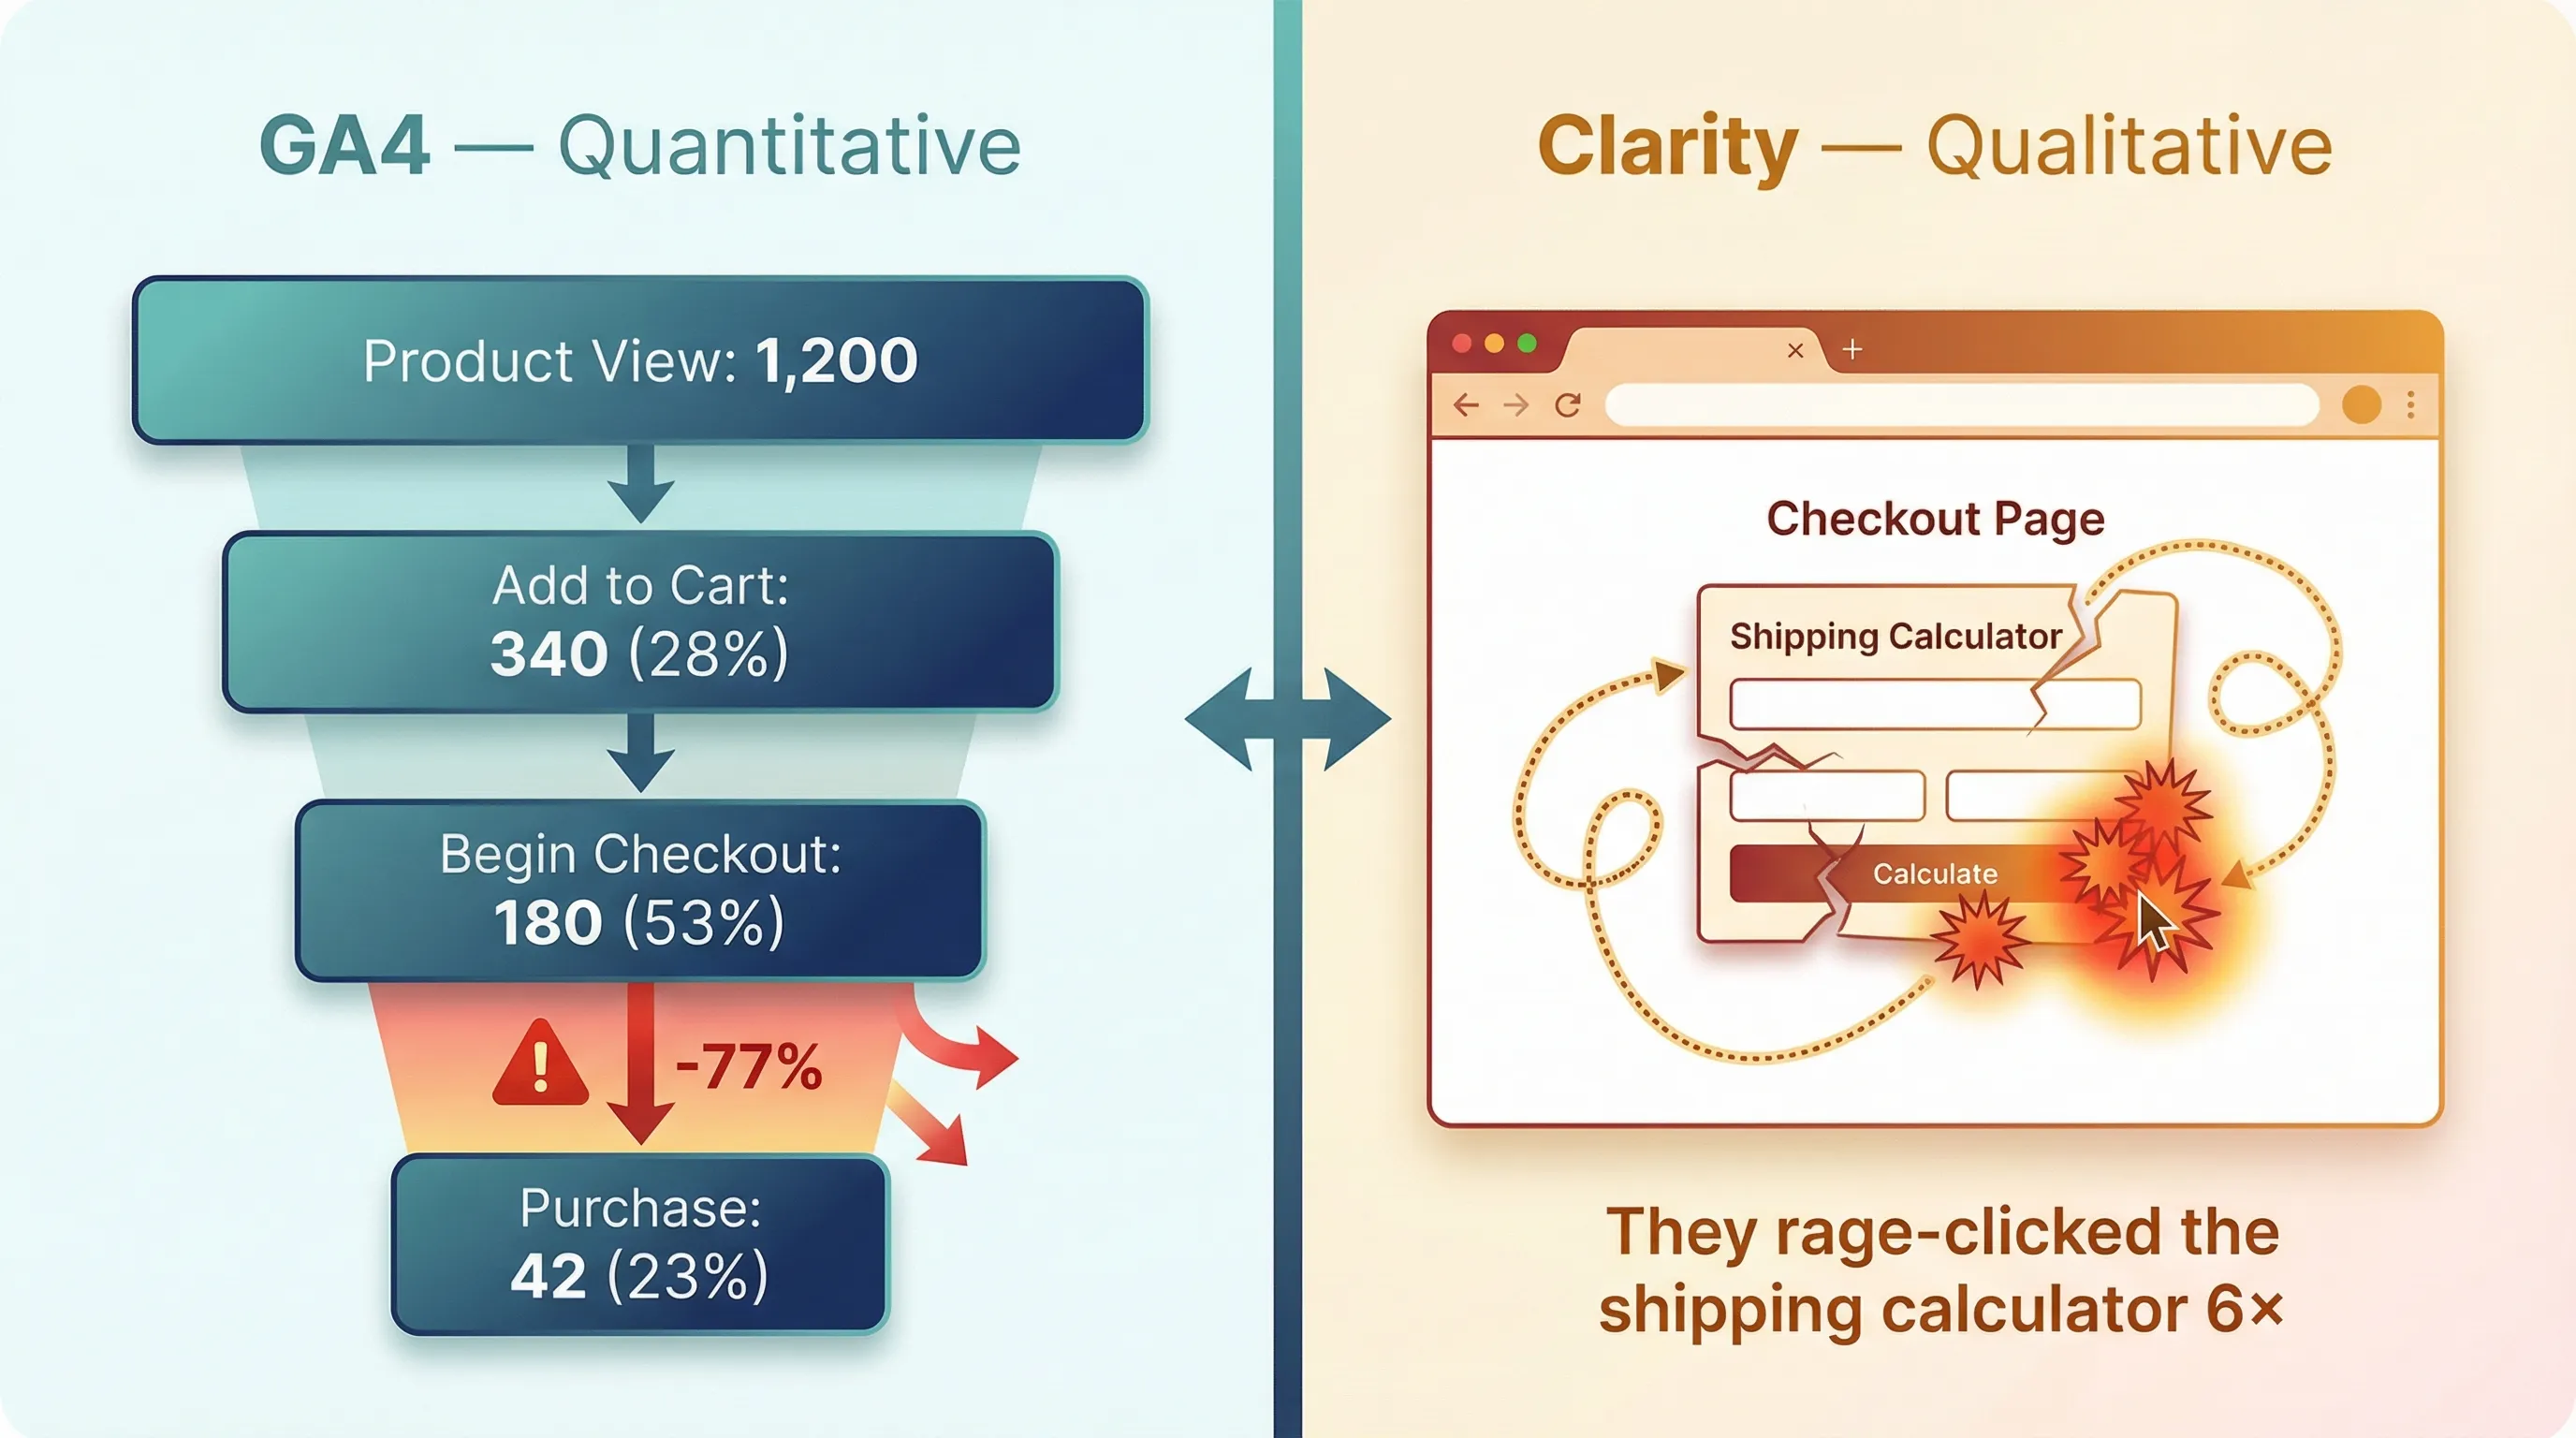
GA4 tells you that 70% of users abandon at checkout. Clarity shows you that they’re rage-clicking a broken shipping calculator. GA4 shows high bounce rates on your landing page. Clarity reveals that users never scroll past the hero image because the page loads too slowly on mobile.
Quantitative data from GA4 identifies problems. Qualitative data from Clarity explains them. This combination is essential for answering your “why” questions; where do potential customers get confused, frustrated, or stuck?
Important Note: While Clarity is preferably implemented via GTM for consistency with your other tracking, it may not always be possible. What matters is having it in place to capture the qualitative behaviour data that complements your quantitative GA4 metrics.
How It Fits:
Clarity works in parallel with GA4 events. While GA4 measures specific actions, Clarity captures complete context. When something in GA4 triggers an investigation (like high cart abandonment), you use Clarity session recordings to understand the user experience issues causing the problem.
Implementation:
For implementation details, see How to Install Microsoft Clarity.
To understand the difference compared to Google Analytics, see Microsoft Clarity vs Google Analytics.
Attribution: UTM Parameters
What It Does:
The Aware stage of the ARC framework is about discovery; how users find your offers. But knowing that people arrived at your site is useless without knowing Where they came from and How they arrived. Did they search for you intentionally? Click a paid ad? Follow a social media link? Click a call to action in an email? Each discovery method represents different user intent and typically converts at vastly different rates. UTM parameters are the mechanism that captures this critical information.
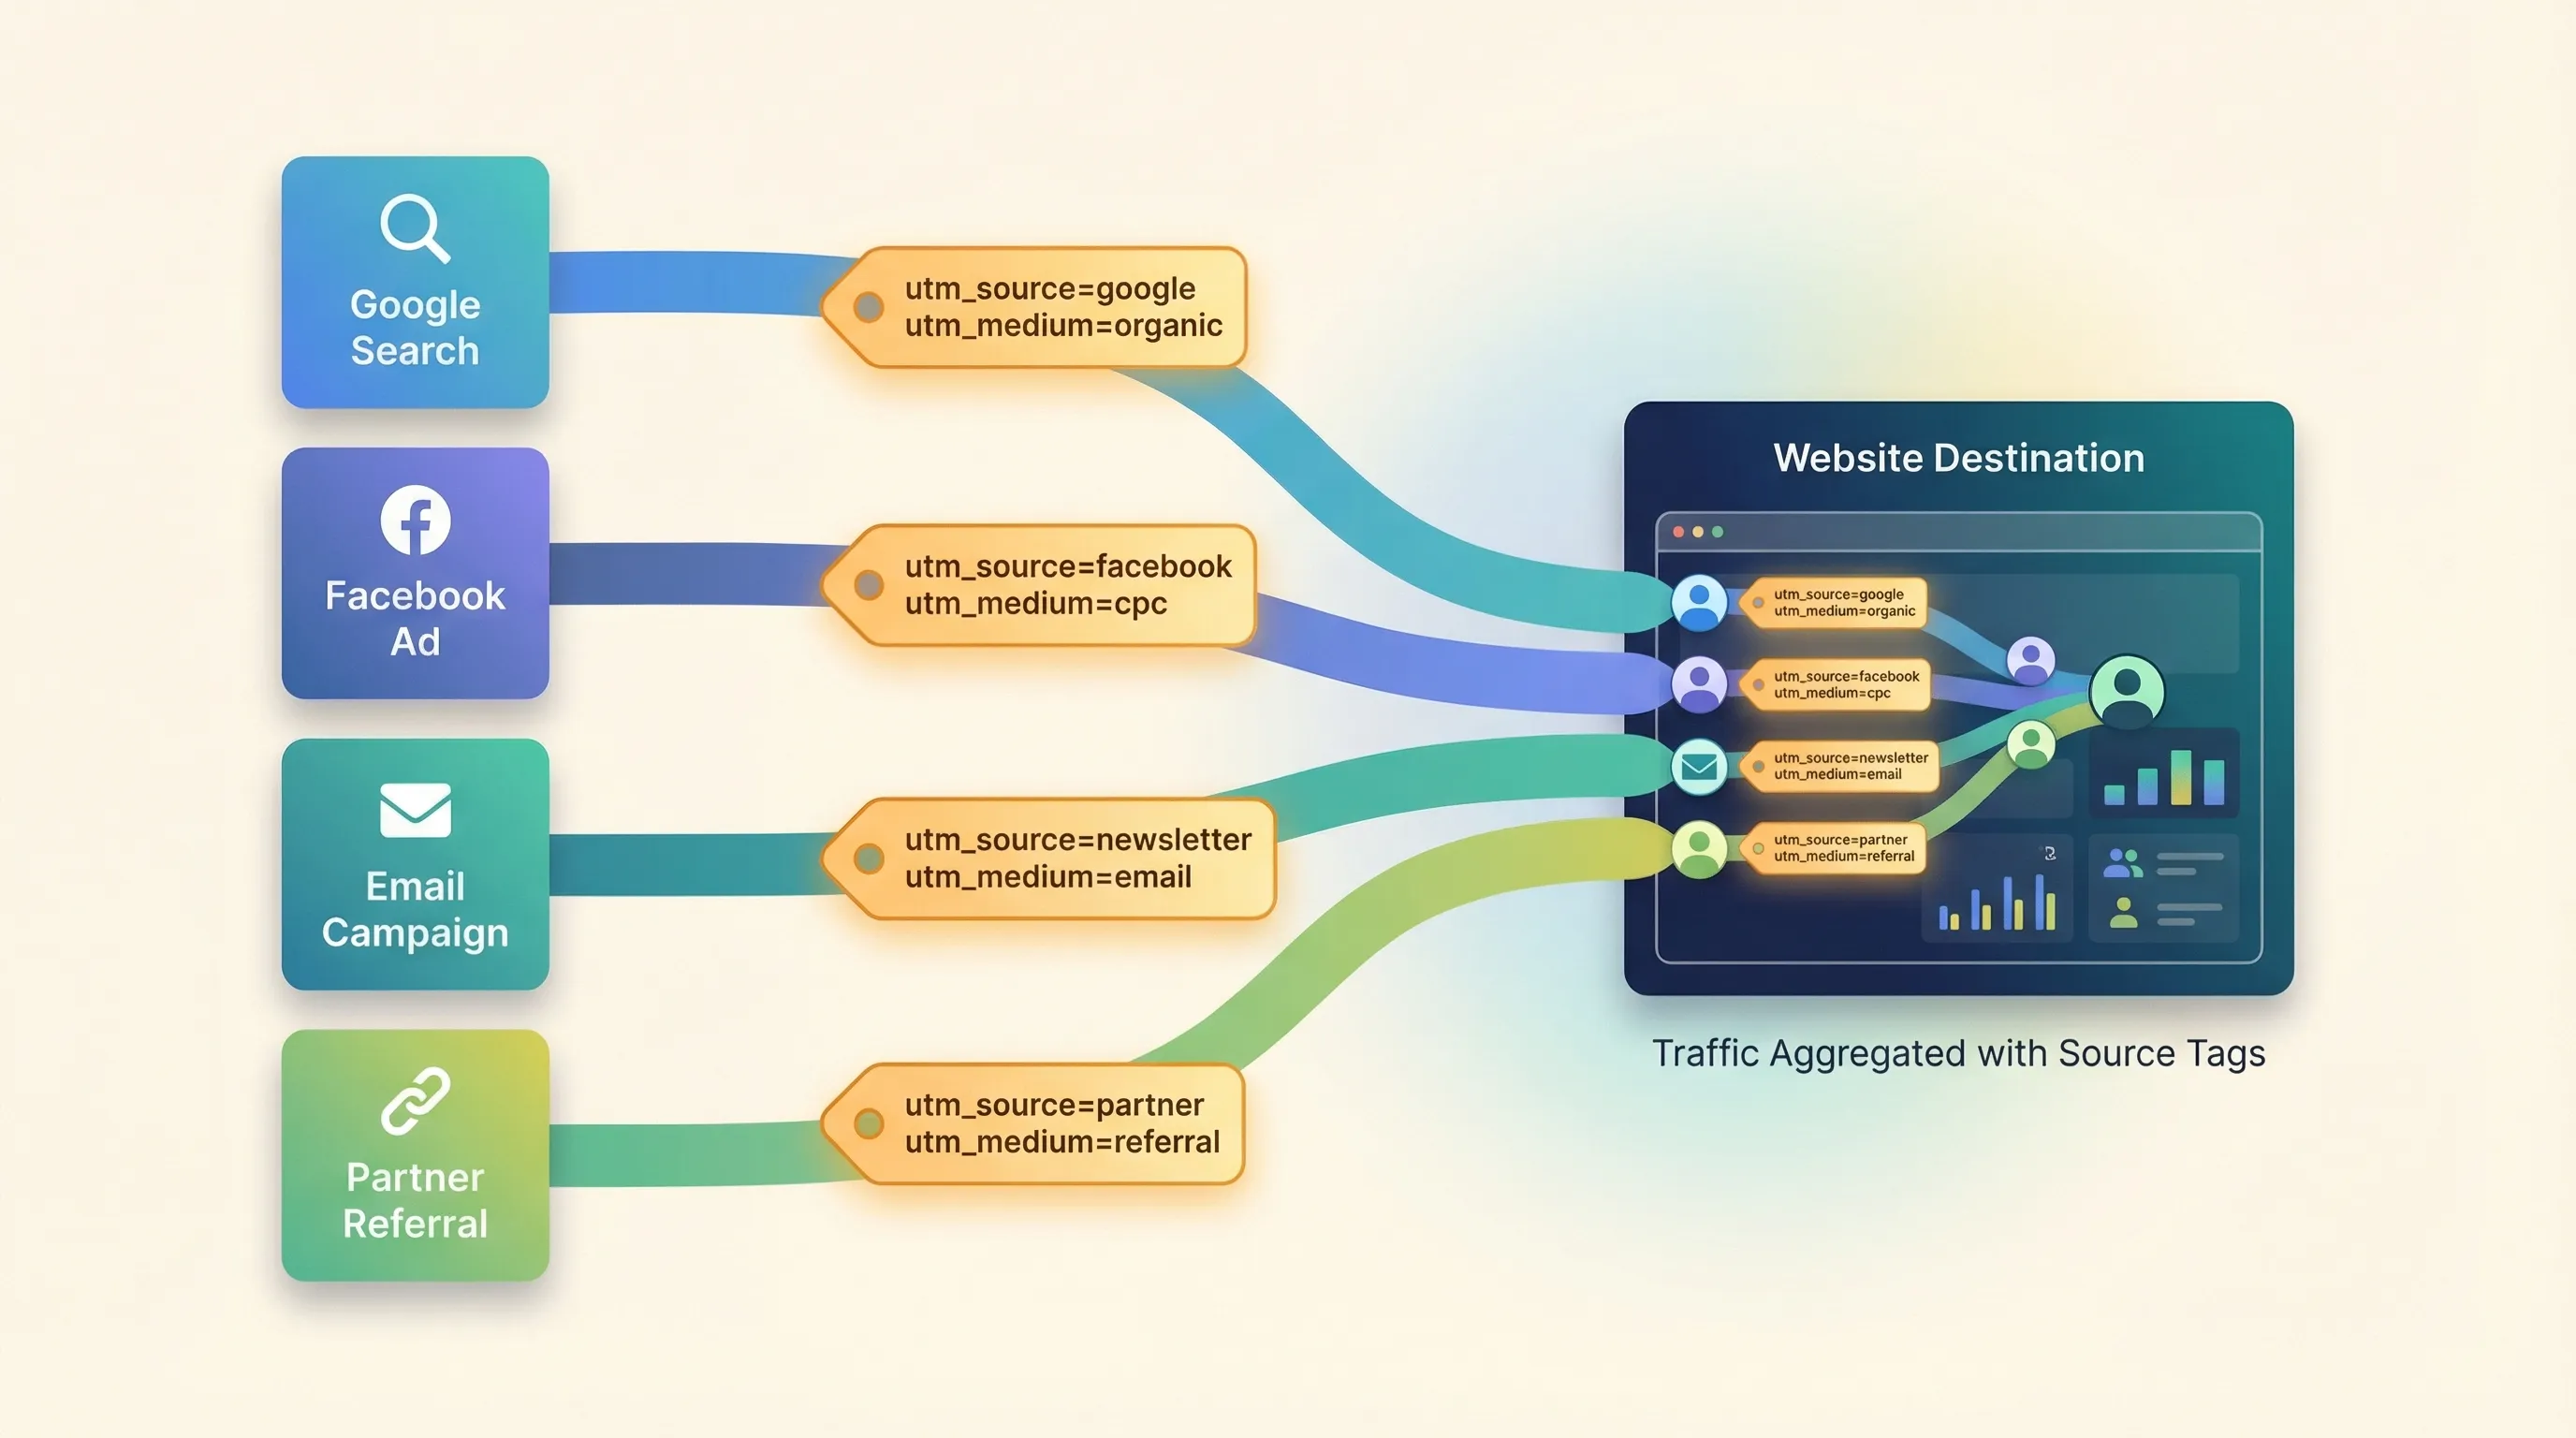
UTM parameters are tags you append to your URLs that identify the source (site or brand they came from), medium (the mechanism that brought them), campaign (the reason they came), and specific creative that drove traffic. When someone clicks a tagged link, these parameters travel with them and get recorded in your analytics platforms.
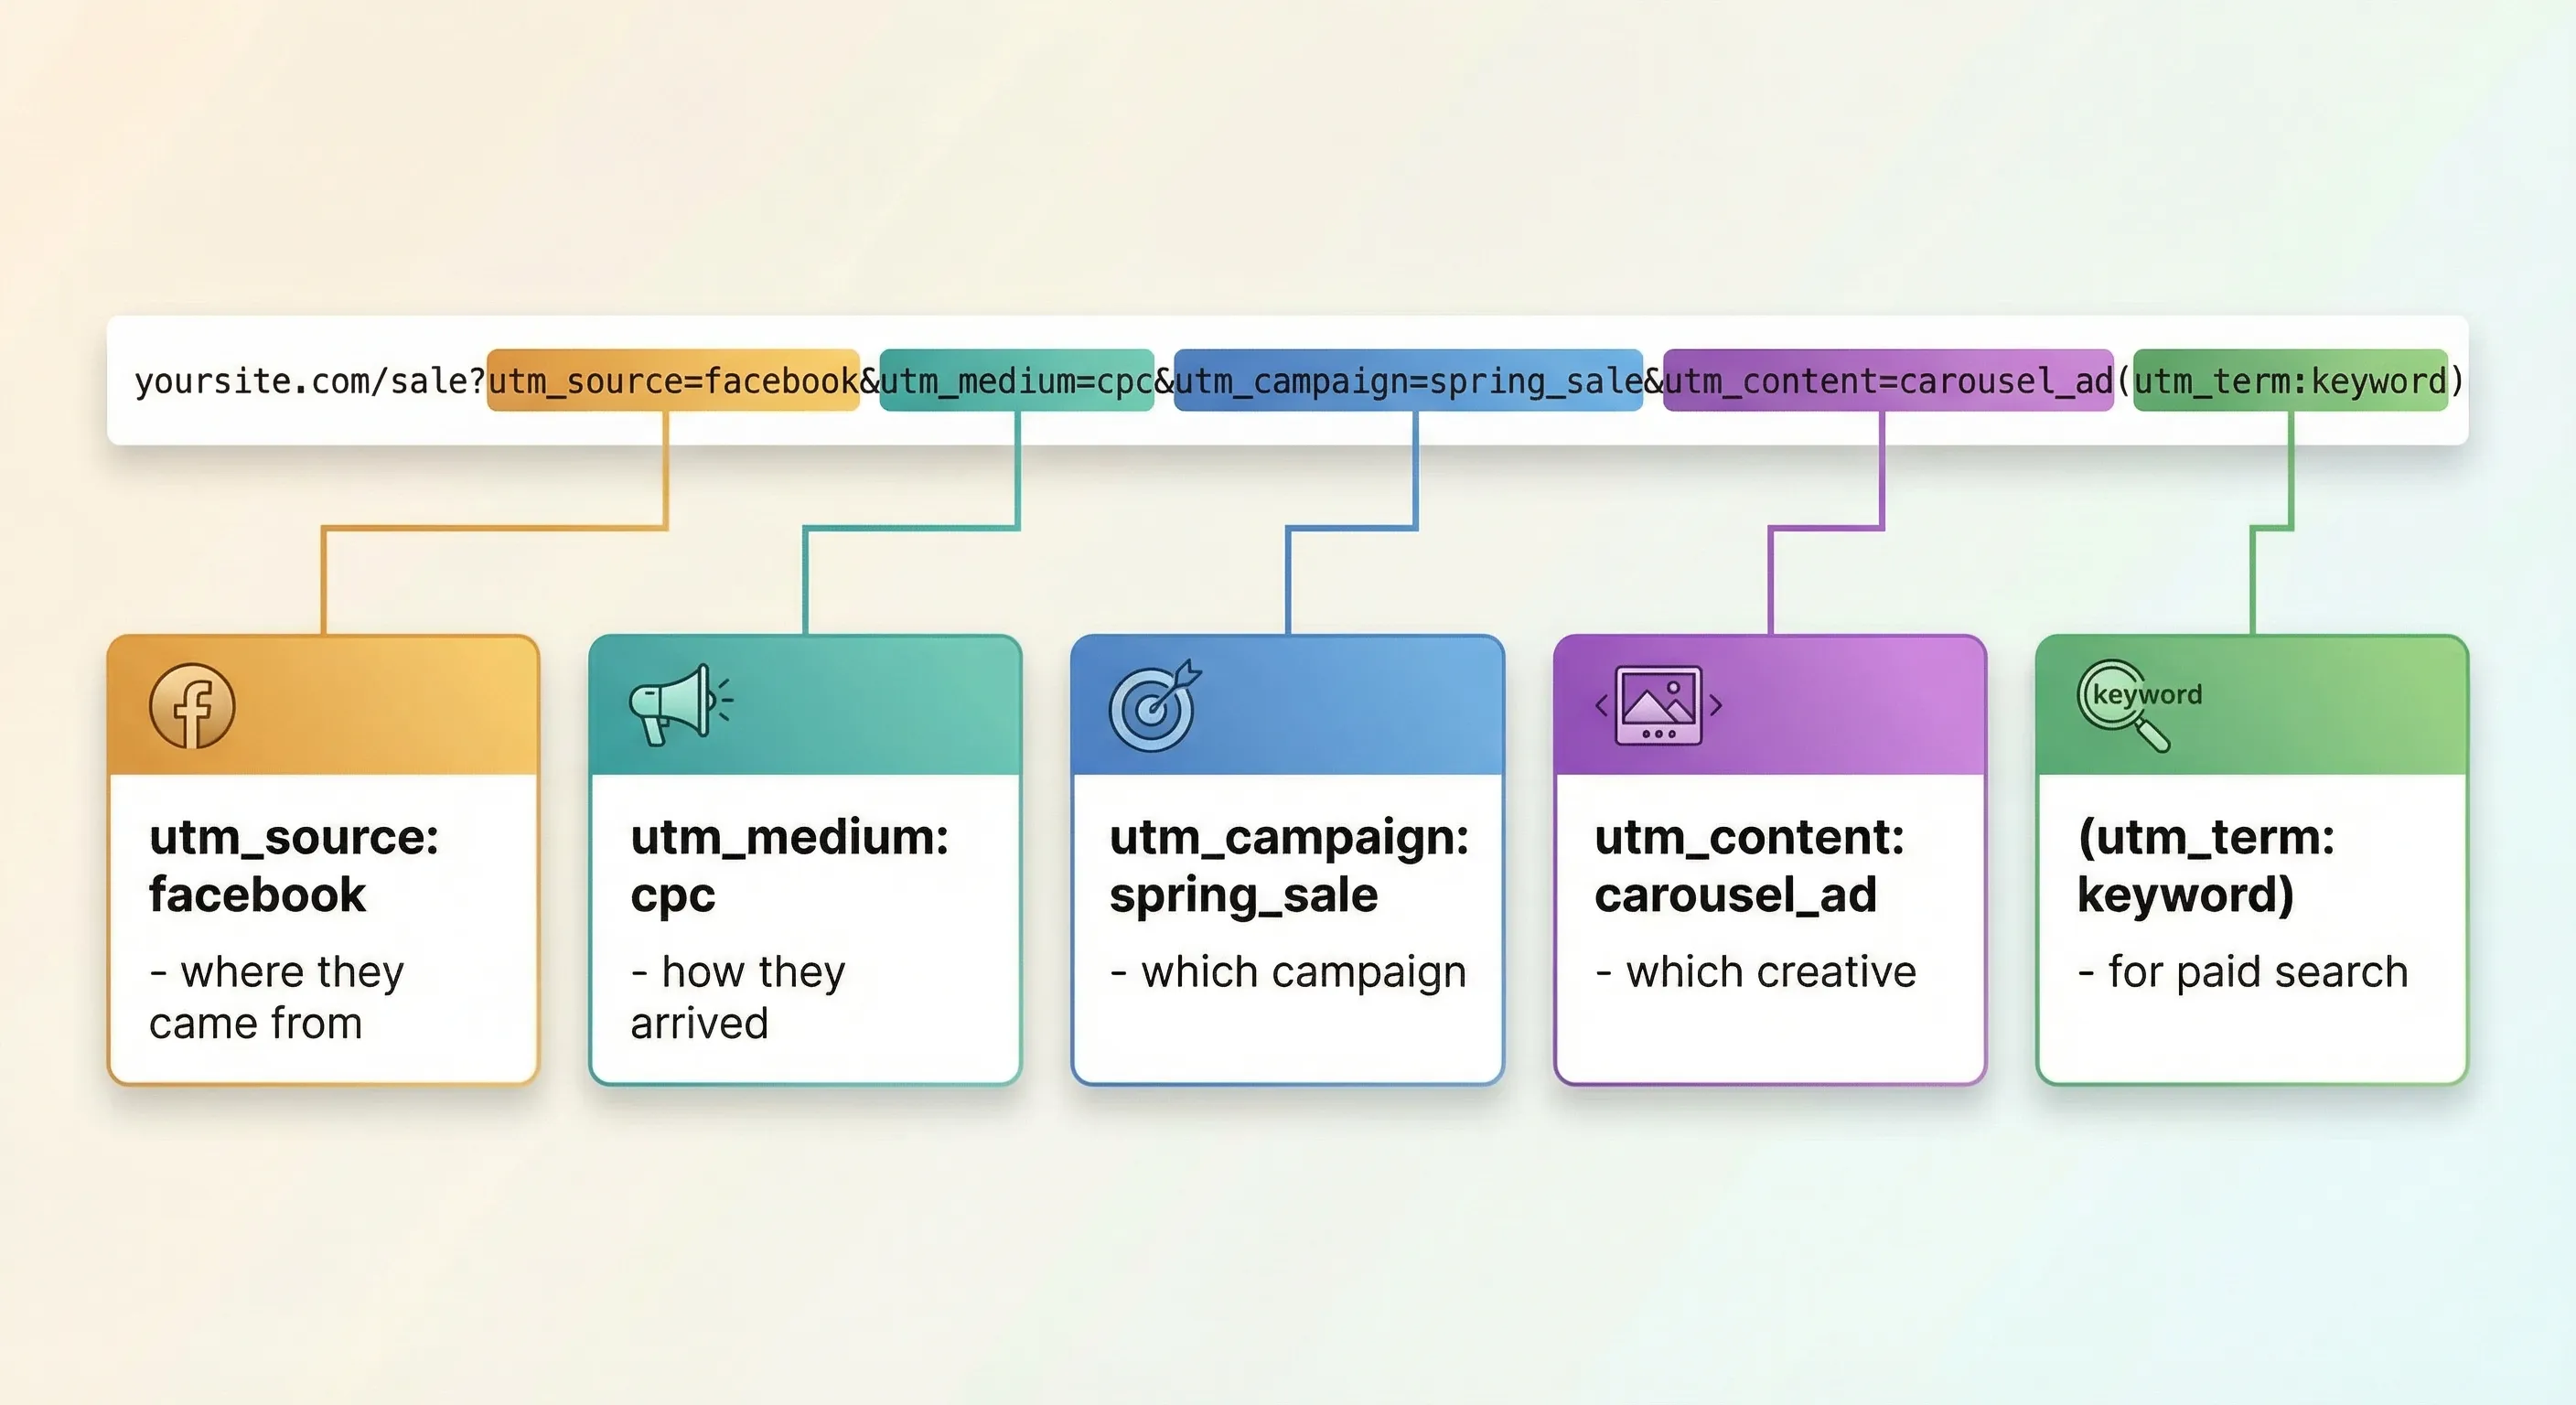
A tagged URL looks like:
https://yoursite.com/sale?utm_source=facebook&utm_medium=cpc&utm_campaign=spring_sale&utm_content=carousel_adThis tells your analytics: “This visitor came from Facebook, via a paid ad, as part of the spring sale campaign, specifically from the carousel ad creative.”
The UTM Parameters:
utm_source: The platform sending traffic (facebook, google, newsletter)utm_medium: The traffic type (cpc, email, social, organic)utm_campaign: The specific campaign or initiative (spring_sale, product_launch)utm_content: The specific ad or link (carousel_ad, text_link, button_cta)utm_term: The keyword (primarily for paid search)
Why It Matters:
Without UTM parameters, you cannot answer the most critical Aware stage question: Which channels bring us the most qualified traffic that actually converts?
All your paid social traffic appears as generic “facebook/referral” in reports. You cannot distinguish between organic posts and paid campaigns, between different campaign objectives, or between different ad creatives. More critically, you cannot connect Aware behaviours (how users discovered you) to Convert behaviours (whether they took valuable actions).
This is the data that answers your Aware stage KPQs:
- Which channels bring us the most qualified traffic that actually converts? (UTMs identify the channel and campaign)
- Which content attracts visitors who engage deeply with our site? (UTMs show which campaigns drove engaged users)
- Which traffic sources convert at the highest rate? (UTMs enable conversion rate analysis by source)
Without UTM parameters, you’re flying blind at the top of your funnel. You might see that 10,000 people visited your site, but you have no idea which marketing efforts made that happen or which discovery sources lead to actual business outcomes. UTM parameters are what transform generic “traffic” into actionable attribution data.
How It Fits:
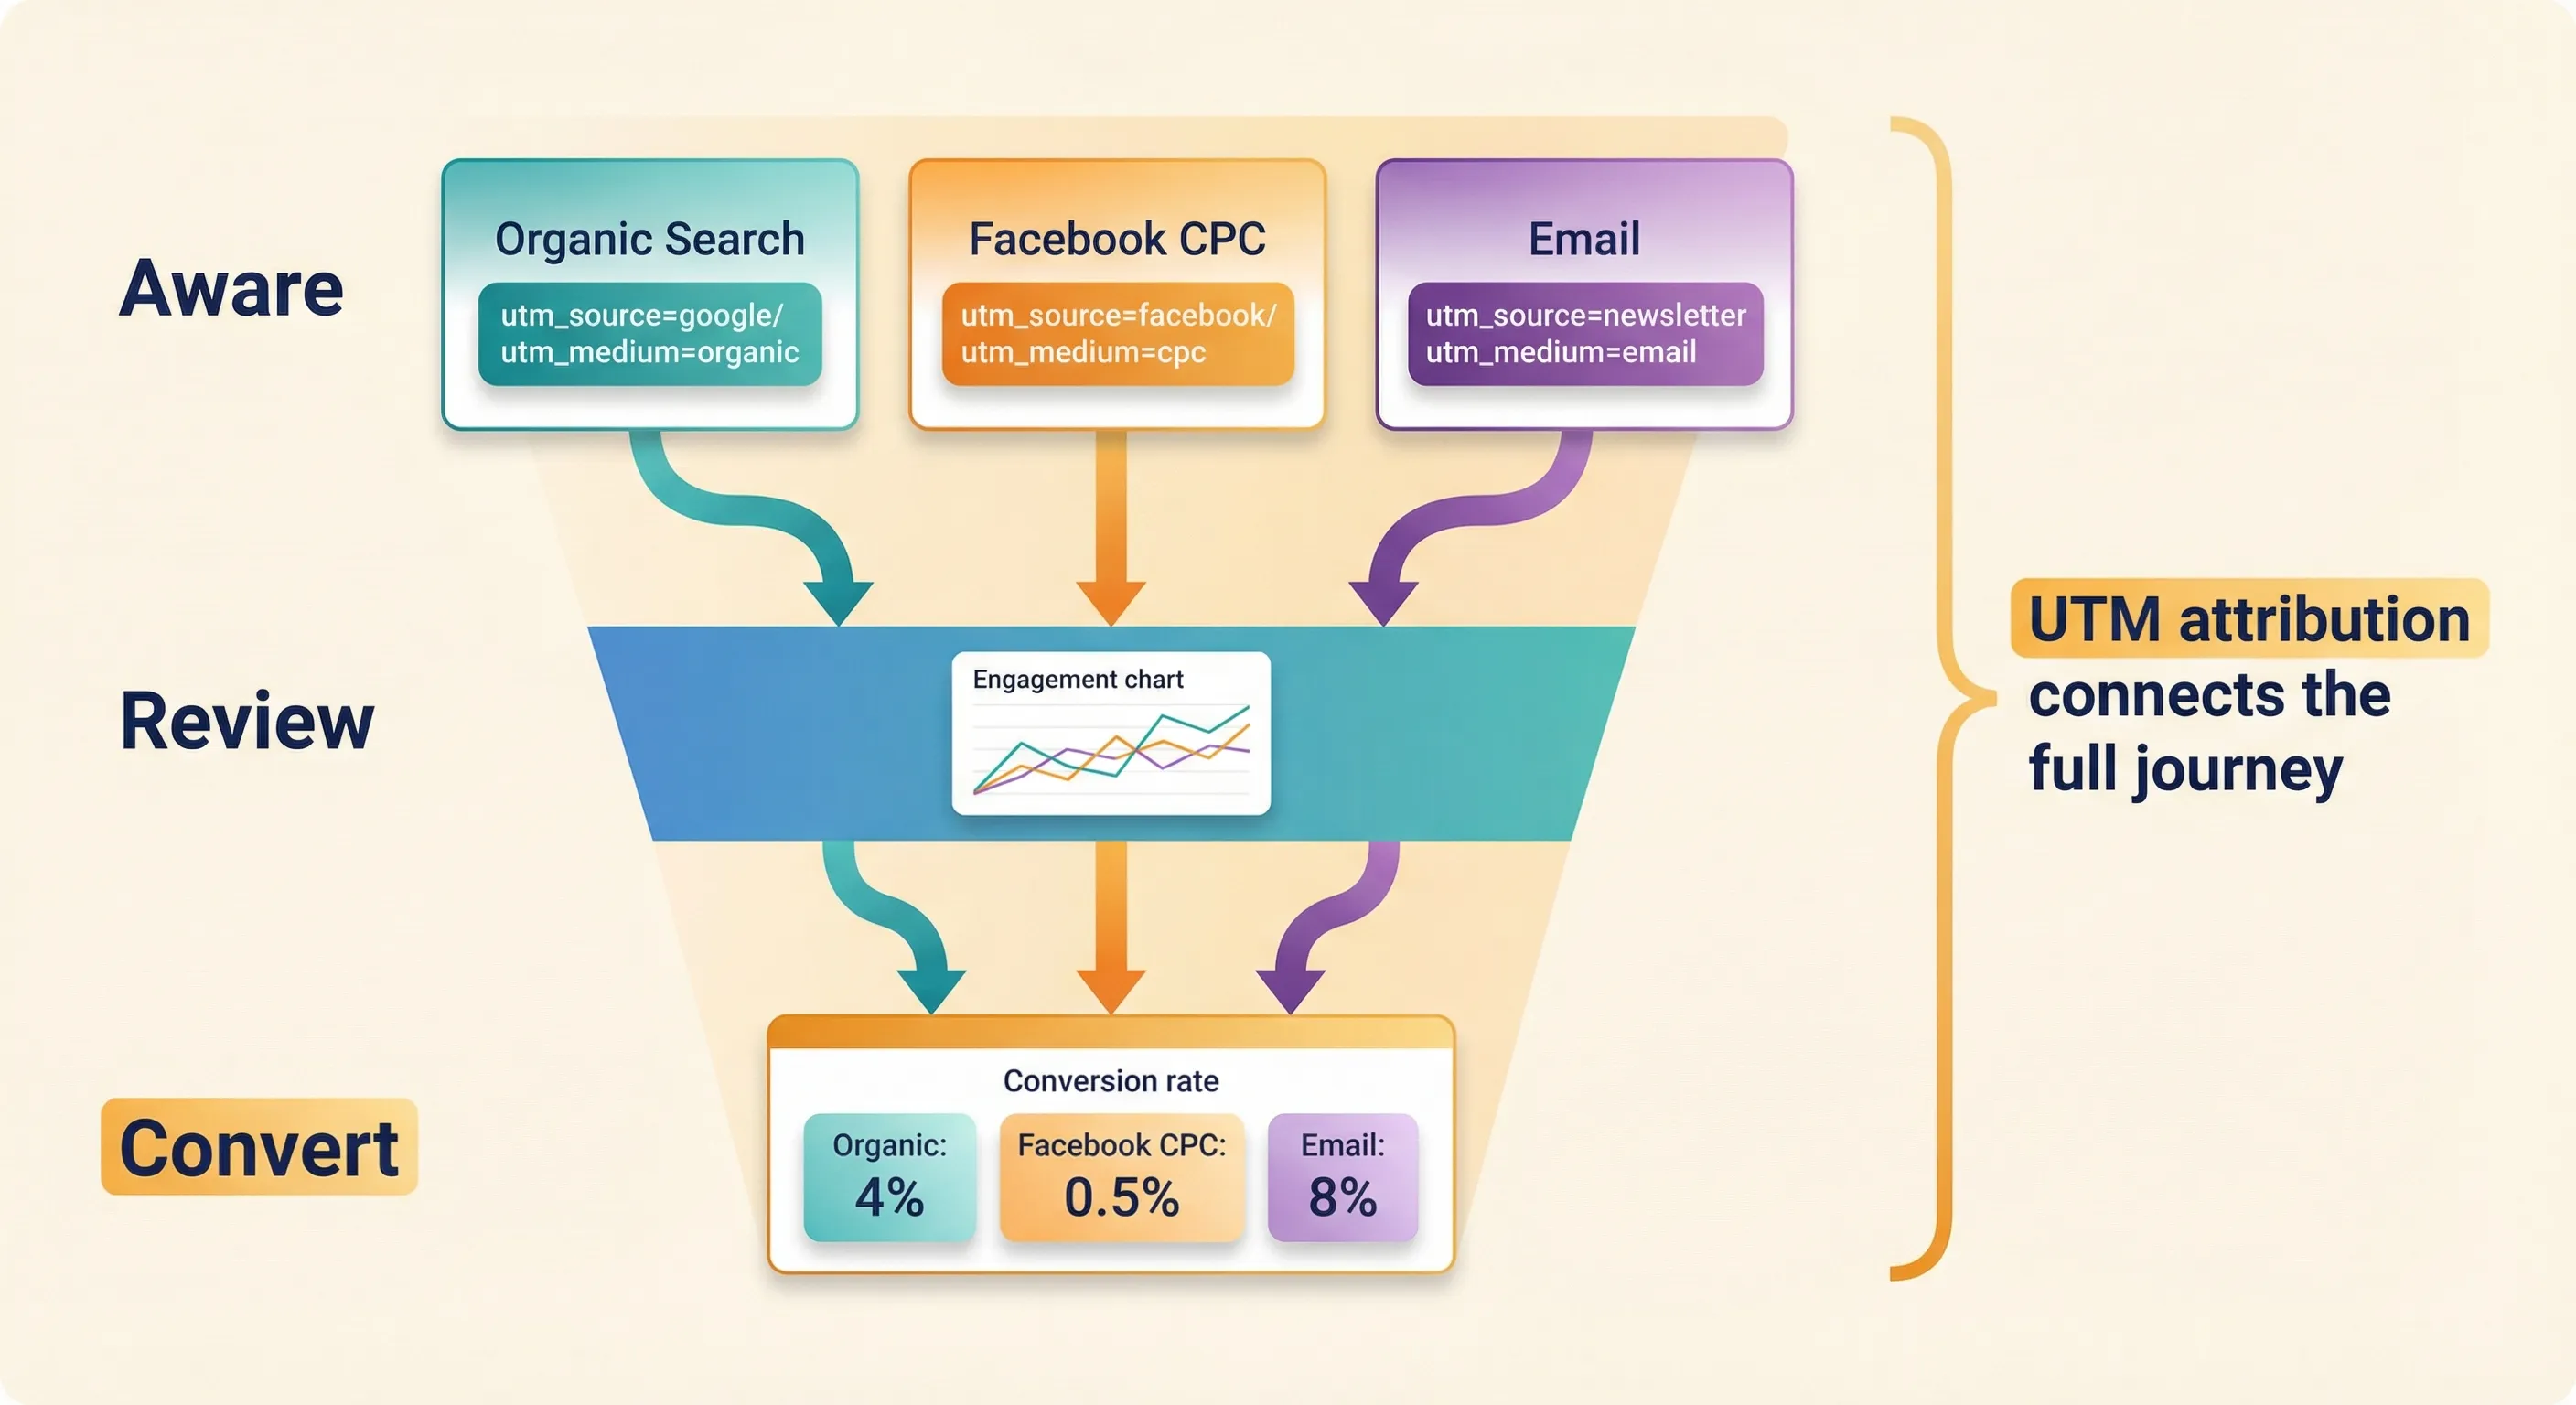
UTM parameters attach to traffic before it reaches your site, tagging the Aware behaviour (discovery) at its source. When users arrive and trigger events (tracked via GA4), those events carry the UTM classification, connecting Aware behaviours to Review and Convert behaviours.
This is what enables funnel analysis: you can see which discovery channels (Aware) lead to the highest engagement (Review) and conversion rates (Convert). You can identify that organic search traffic converts at 4% while display ads convert at 0.5%, even though both drove similar visitor volumes. You can compare email campaigns that convert at 8% versus social ads that convert at 1%.
Without this connection between Aware and Convert, you cannot answer whether your top-of-funnel marketing investments actually drive bottom-of-funnel results. You’re measuring traffic volume without understanding traffic quality.
Implementation:
To learn more about UTM tagging see UTM Parameters Guide
Conversion Tracking
Conversion tracking is the process of classifying specific events (behaviours) as conversion; actions that represent meaningful business outcomes. Not all events are equally valuable. Someone viewing a product page is worth measuring, but it’s not as valuable as someone completing a purchase. Conversion tracking tells your platforms: “This event is important. Optimise for it.“
GA4 Conversions
What It Does:
In GA4, you mark events like purchase or generate_lead as “key events” (conversions). This classification serves two purposes: it allows you to track conversion rates and measure which traffic sources drive valuable actions, and it enables GA4's machine learning to identify patterns and build predictive audiences.
The Conversion Hierarchy:
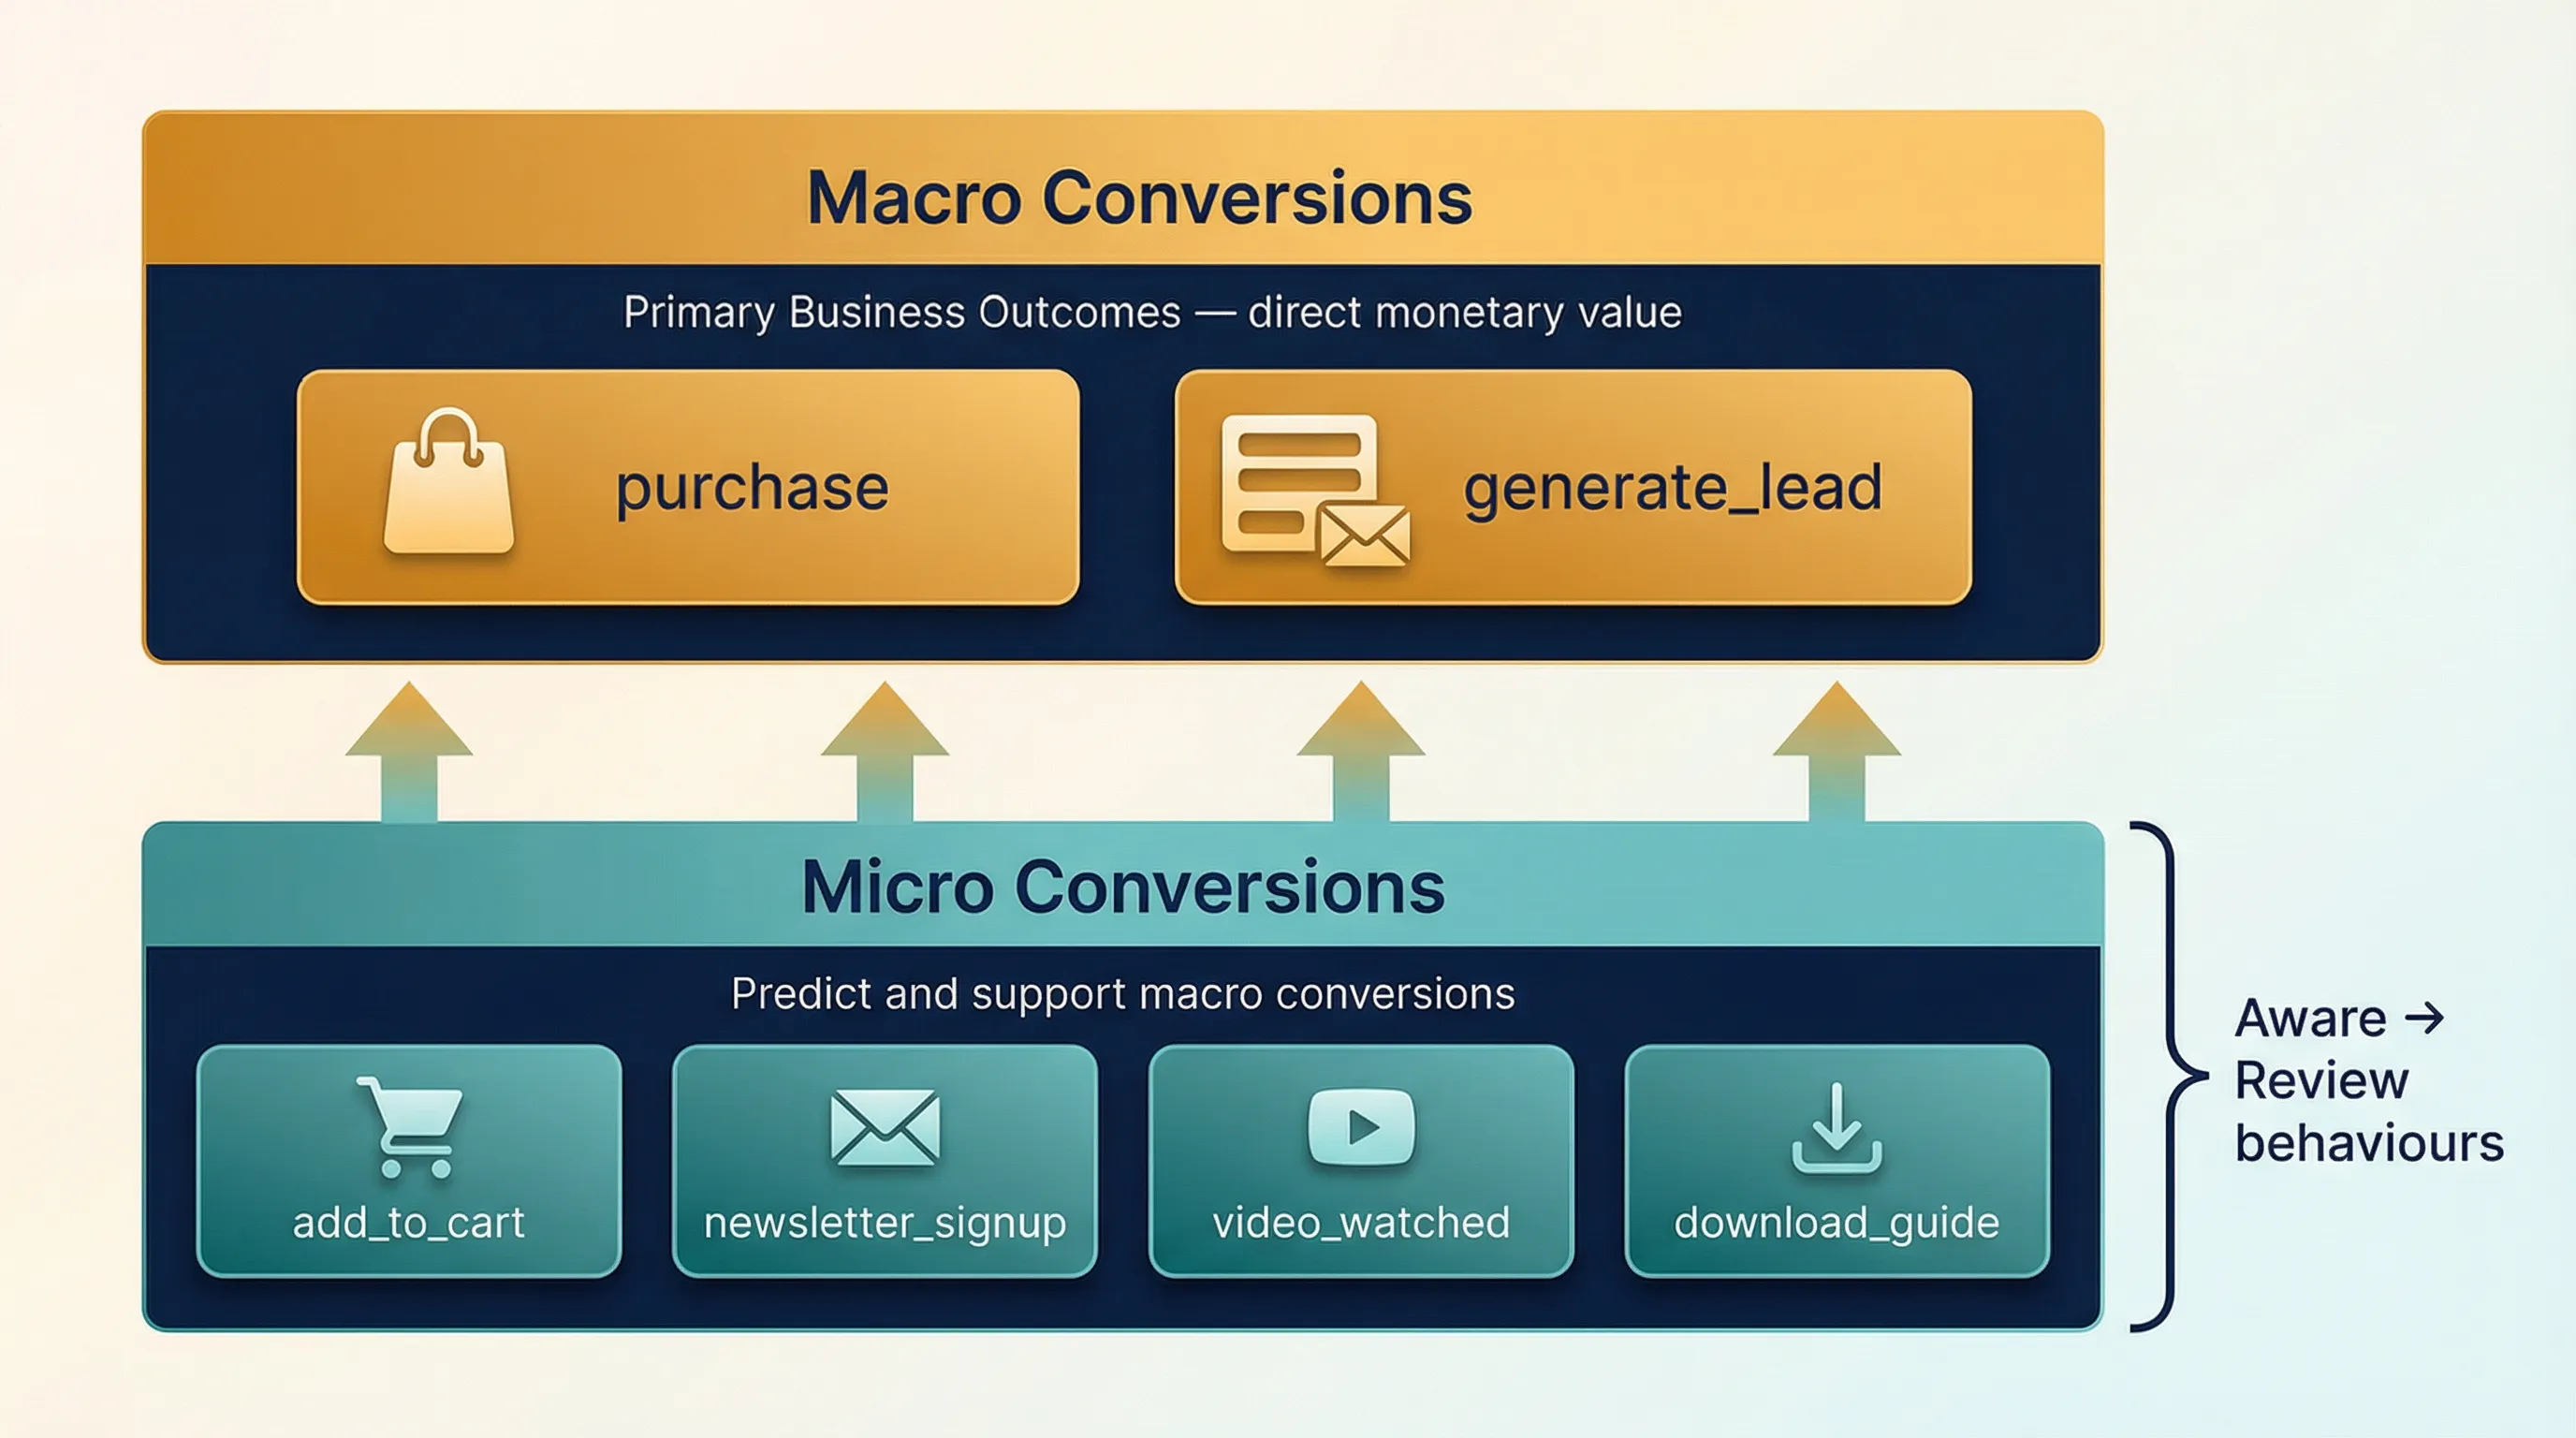
Macro Conversions: Primary business outcomes with direct monetary value. For ecommerce: purchase. For lead generation: generate_lead, request_quote.
Micro Conversions: Secondary actions that predict macro conversions. Examples: add_to_cart, newsletter_signup, download_guide, video_watched. These indicate interest and intent even without immediate revenue.
Why It Matters:
Marking events as conversions in GA4 enables you to answer your most critical outcome questions: “What is our conversion rate overall and by traffic source?” and “Which traffic sources convert at the highest rate?“
When you’ve implemented recommended events properly and marked them as key events, GA4 uses machine learning to identify Likely 7-day purchasers or Churn probability segments. This predictive capability helps you proactively target high-value prospects.
How It Fits:
Conversion tracking in GA4 connects to every other part of your foundation. The events you’re tracking (via GA4 implementation) get marked as conversions. Those conversion events carry UTM parameters (from attribution) showing which sources drove them. This data flows to Looker Studio where you can analyse conversion rates and costs across all channels.
Notice how Micro Conversion tend to map to the Review part of ARC. Thus ARC is used to determine your Micro and Macro Conversions.
Implementation:
Post coming soon: Key Event in Google Analytics 4.
Marketing Platform Conversions
What It Does:
Marketing platforms like Google Ads, Facebook Ads Manager, and LinkedIn Campaign Manager need to know which events are conversions so they can optimise campaign delivery. When you’ve implemented conversion tracking properly, these platforms know which ads drive valuable actions and automatically show those ads to more people likely to convert.
Each platform requires specific conversion tracking setup:
Google Ads: While you can import GA4 key events as Google Ads conversions, this has a delay so the recommended method is to set up Google Ads conversion tags, preferably using Google Tag Manager. The platform tracks when users who clicked your ads complete conversion events, enabling automated bidding strategies that optimise for conversions rather than just clicks.
Facebook Ads: You configure your Facebook Pixel to send conversion events when users complete valuable actions. Facebook’s algorithm uses this data to optimise ad delivery, finding audiences similar to those who convert.
Other Platforms: LinkedIn, TikTok, Pinterest, and other advertising platforms have similar conversion tracking requirements. Each needs to receive conversion signals to optimise effectively.
Why It Matters:
Without feeding conversion data to ad platforms, they optimise for clicks, not outcomes. You pay for traffic that never converts because the algorithm doesn’t know what “success” looks like for your business.
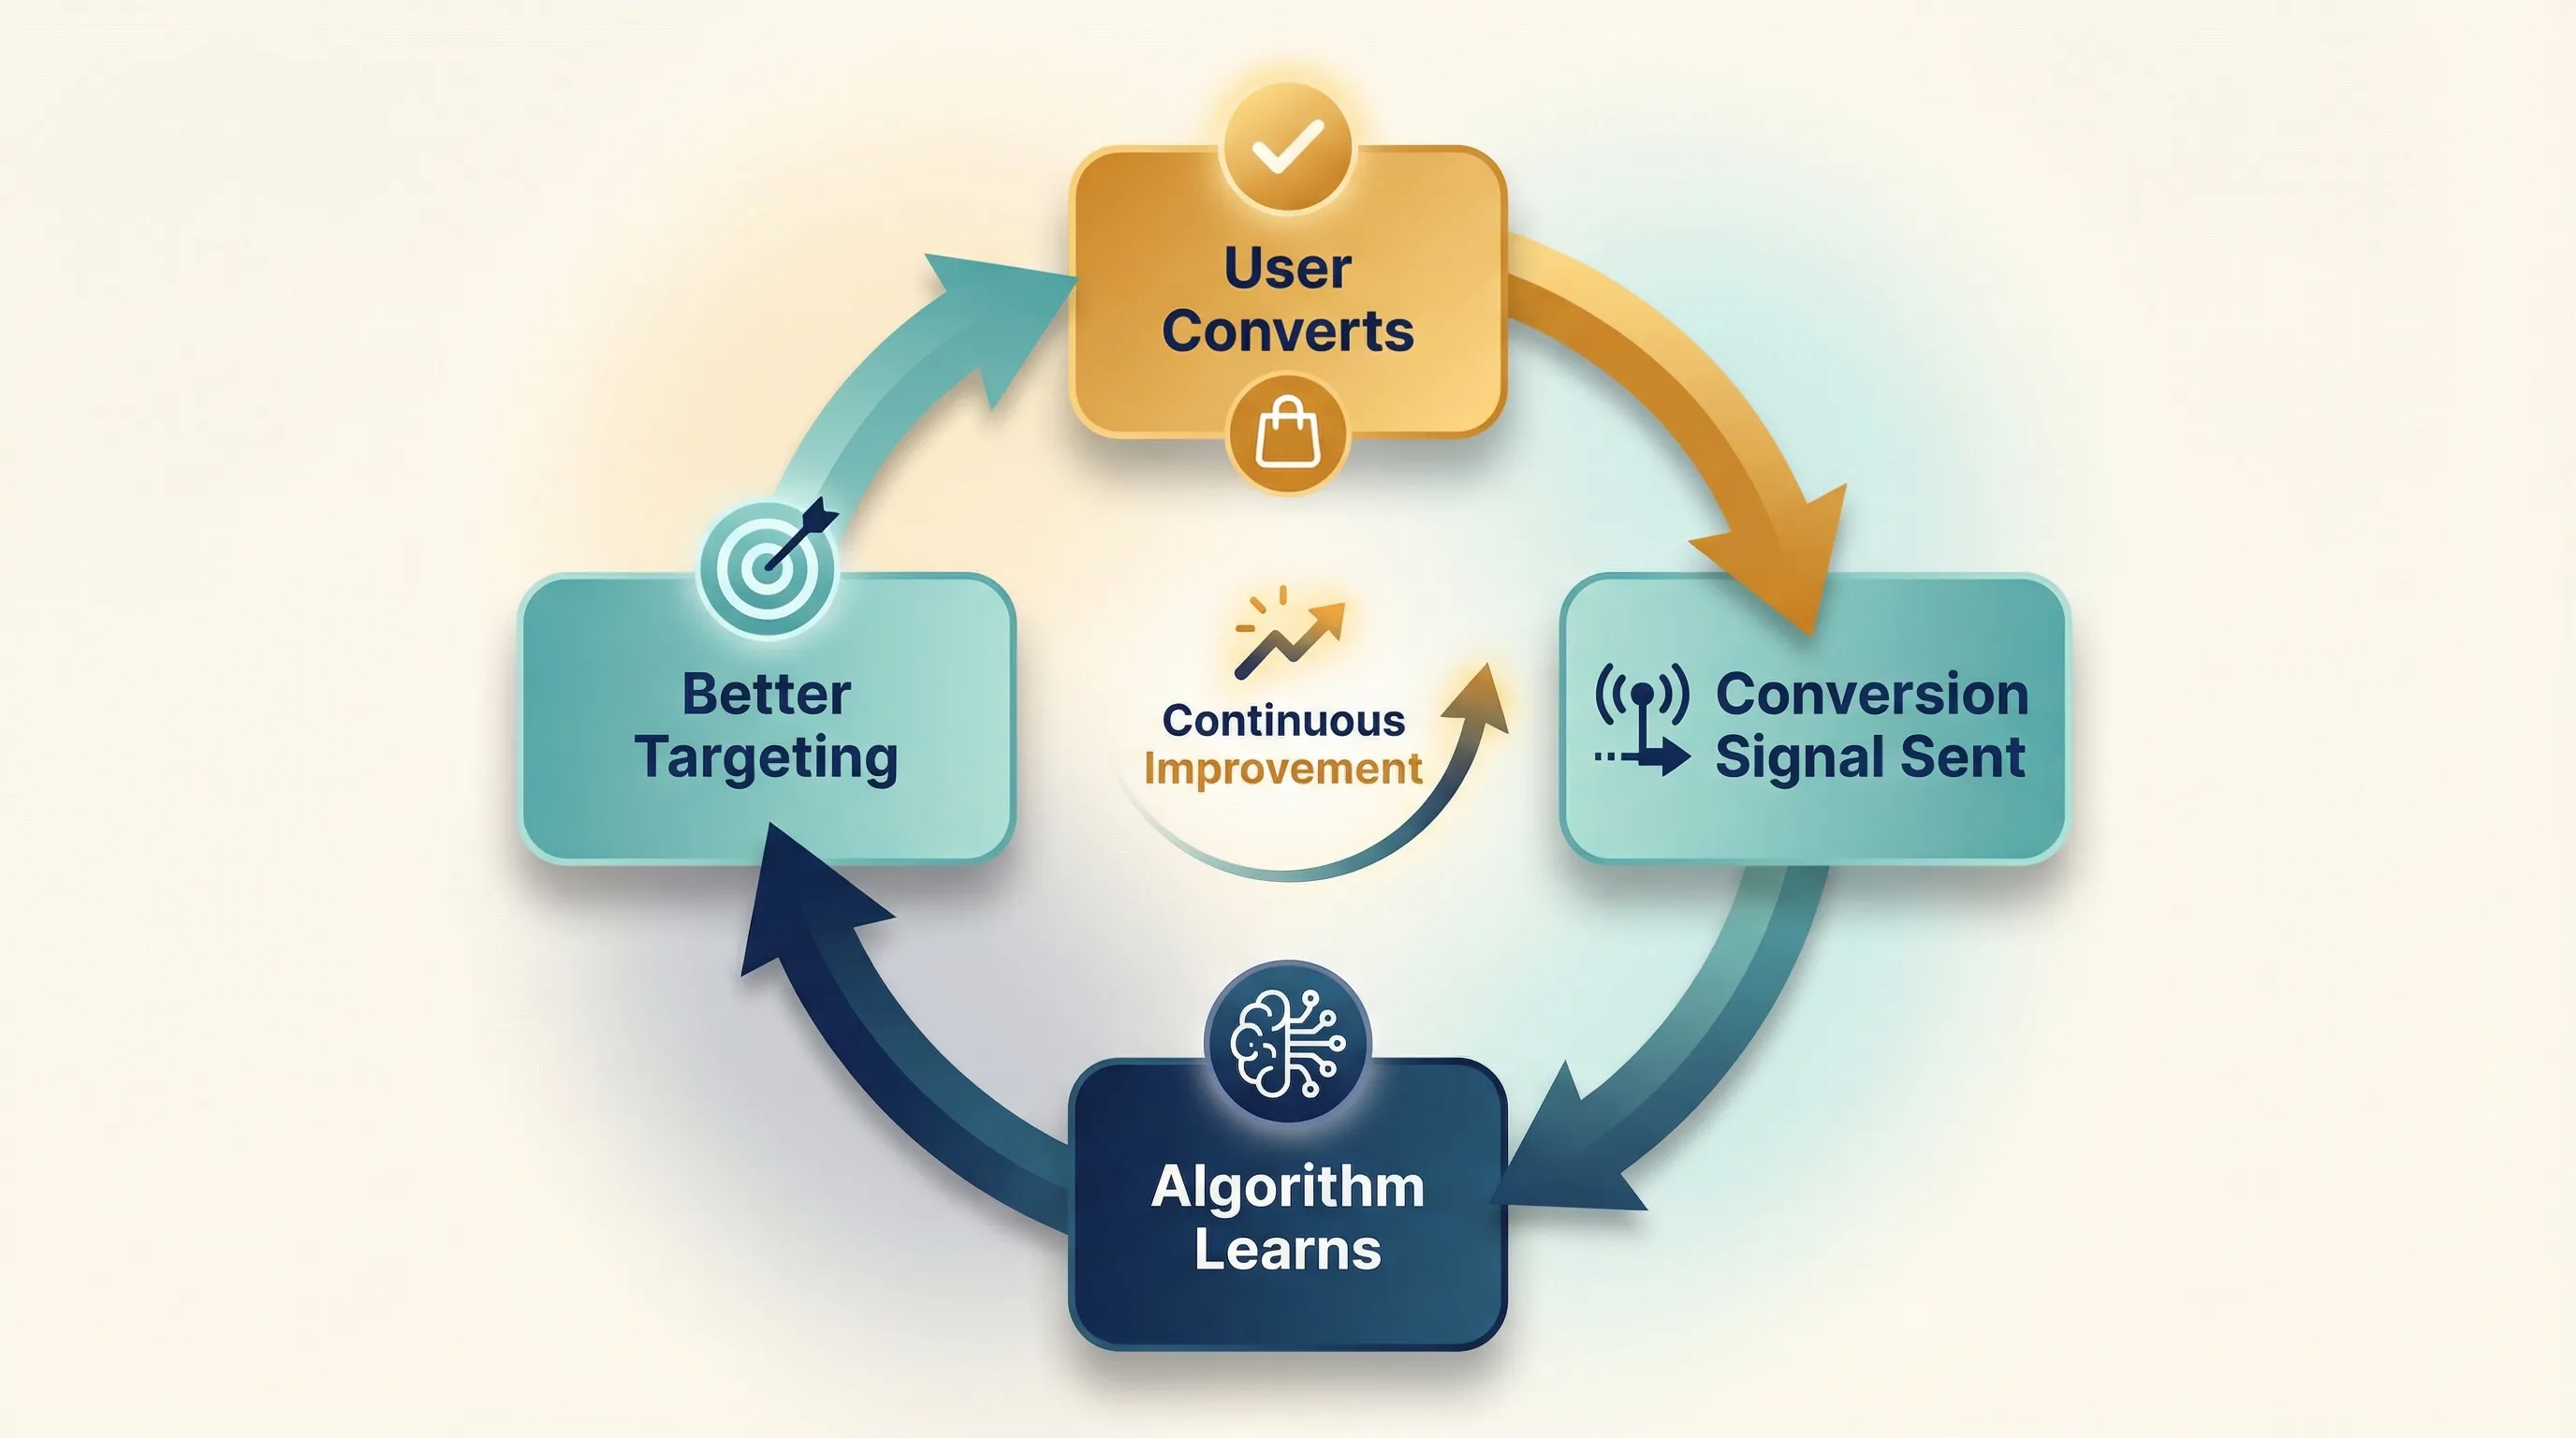
With proper conversion tracking, machine learning finds more people like those who actually convert, systematically improving performance over time. This directly impacts your ability to reduce customer acquisition costs and improve return on ad spend.
Important Note: Conversion tracking for marketing platforms is preferably implemented using GTM for centralised management and easier troubleshooting. However, some platforms may require you to use their built in methods and so on.
How It Fits:
Marketing platforms receive conversion signals from your implementation. When a user who clicked a Google Ads ad completes a purchase event, that conversion gets attributed back to the specific ad in Google Ads. This creates the feedback loop that enables algorithmic optimisation.
Implementation:
For a detailed guide on Ecommerce and Lead conversion tracking for Meta, see Meta Pixel Tracking Using Google Tag Manager and Google Analytics 4 Data Layer.
To learn how to implement conversion tracking for Google Ads, see Google Ads Conversion Tracking Using Google Tag Manager.
Consent Mode
What It Does:
Google Consent Mode is a governance framework that adjusts how Google tags behave based on user consent choices. It allows you to respect user privacy while maintaining measurement capability through conversion modelling.
Why It Matters:
Privacy compliance is often viewed as a legal obligation; a cost centre focused on avoiding fines. But there’s a practical reason beyond avoiding penalties: user consent directly affects what data you can collect.
When users deny cookie consent, traditional tracking stops completely. You lose visibility into whether your marketing drives conversions. Consent Mode addresses this data loss through conversion modelling, allowing you to maintain measurement capability while respecting user privacy choices.
The quality of your consent implementation matters. Privacy banners that use “dark patterns” (deceptive design to manipulate user choices) can face regulatory action. More importantly, users who feel manipulated may reject consent entirely, reducing your data collection. A transparent, clear consent experience makes users more likely to grant consent, giving you better data quality.
How It Works:
Strict privacy compliance traditionally meant data loss. When users reject cookies, you lose tracking capability. This created a false choice: respect privacy or have actionable data.
Consent Mode solves this dilemma with a hybrid approach. It adjusts how Google tags behave based on user consent choices:
- Consent granted: Tags operate normally, storing cookies and collecting detailed user data
- Consent denied: Tags do not store cookies but send anonymous “pings” containing non-identifying information (timestamp, user agent, referrer)
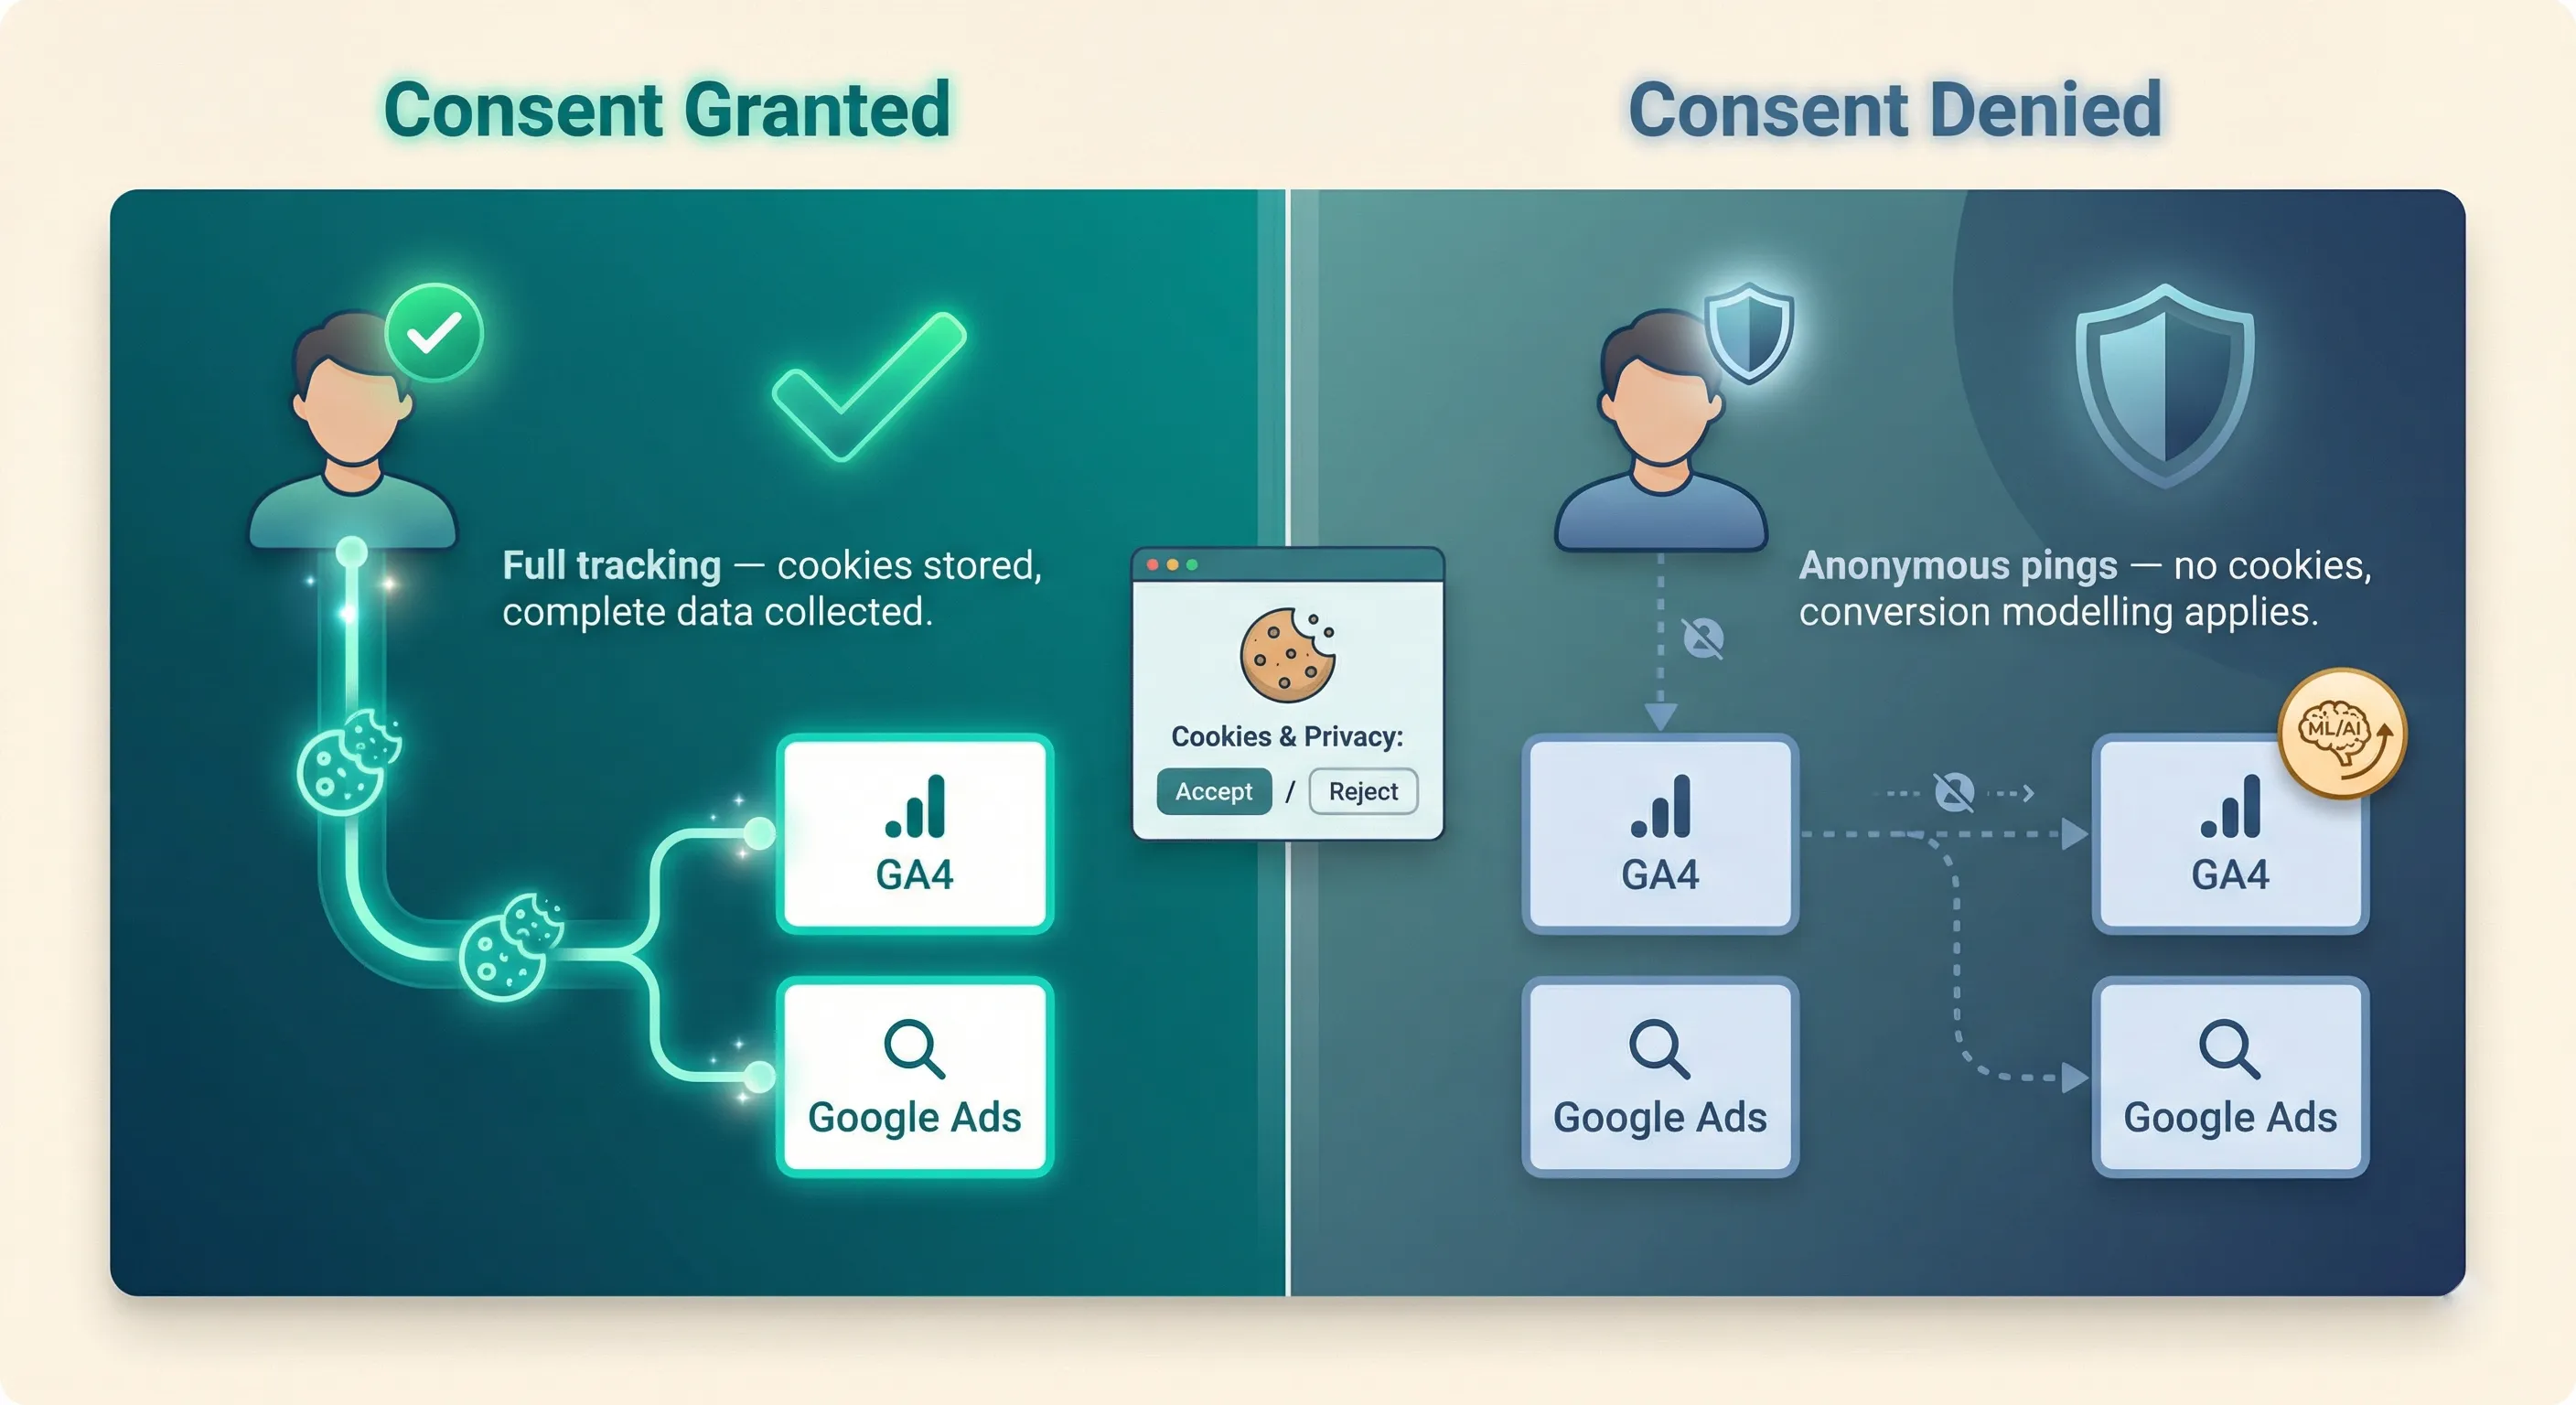
The critical feature is “Conversion Modelling.” Google uses these anonymous pings to model the behaviour of users who denied consent. Implementation partners report significant recovery of conversion data using this approach, allowing you to respect user privacy while maintaining visibility into campaign performance.
How It Fits:
Consent Mode governs how all other tracking behaves. It controls whether GTM tags can store cookies, determining data collection capabilities across your entire foundation. When users deny consent, your GA4 tracking, ad platform pixels, and other tools adjust their behaviour accordingly while still providing modelled conversion data.
Implementation:
Get started with our implementation guide: Cookie Consent with Google Tag Manager.
Google Search Console
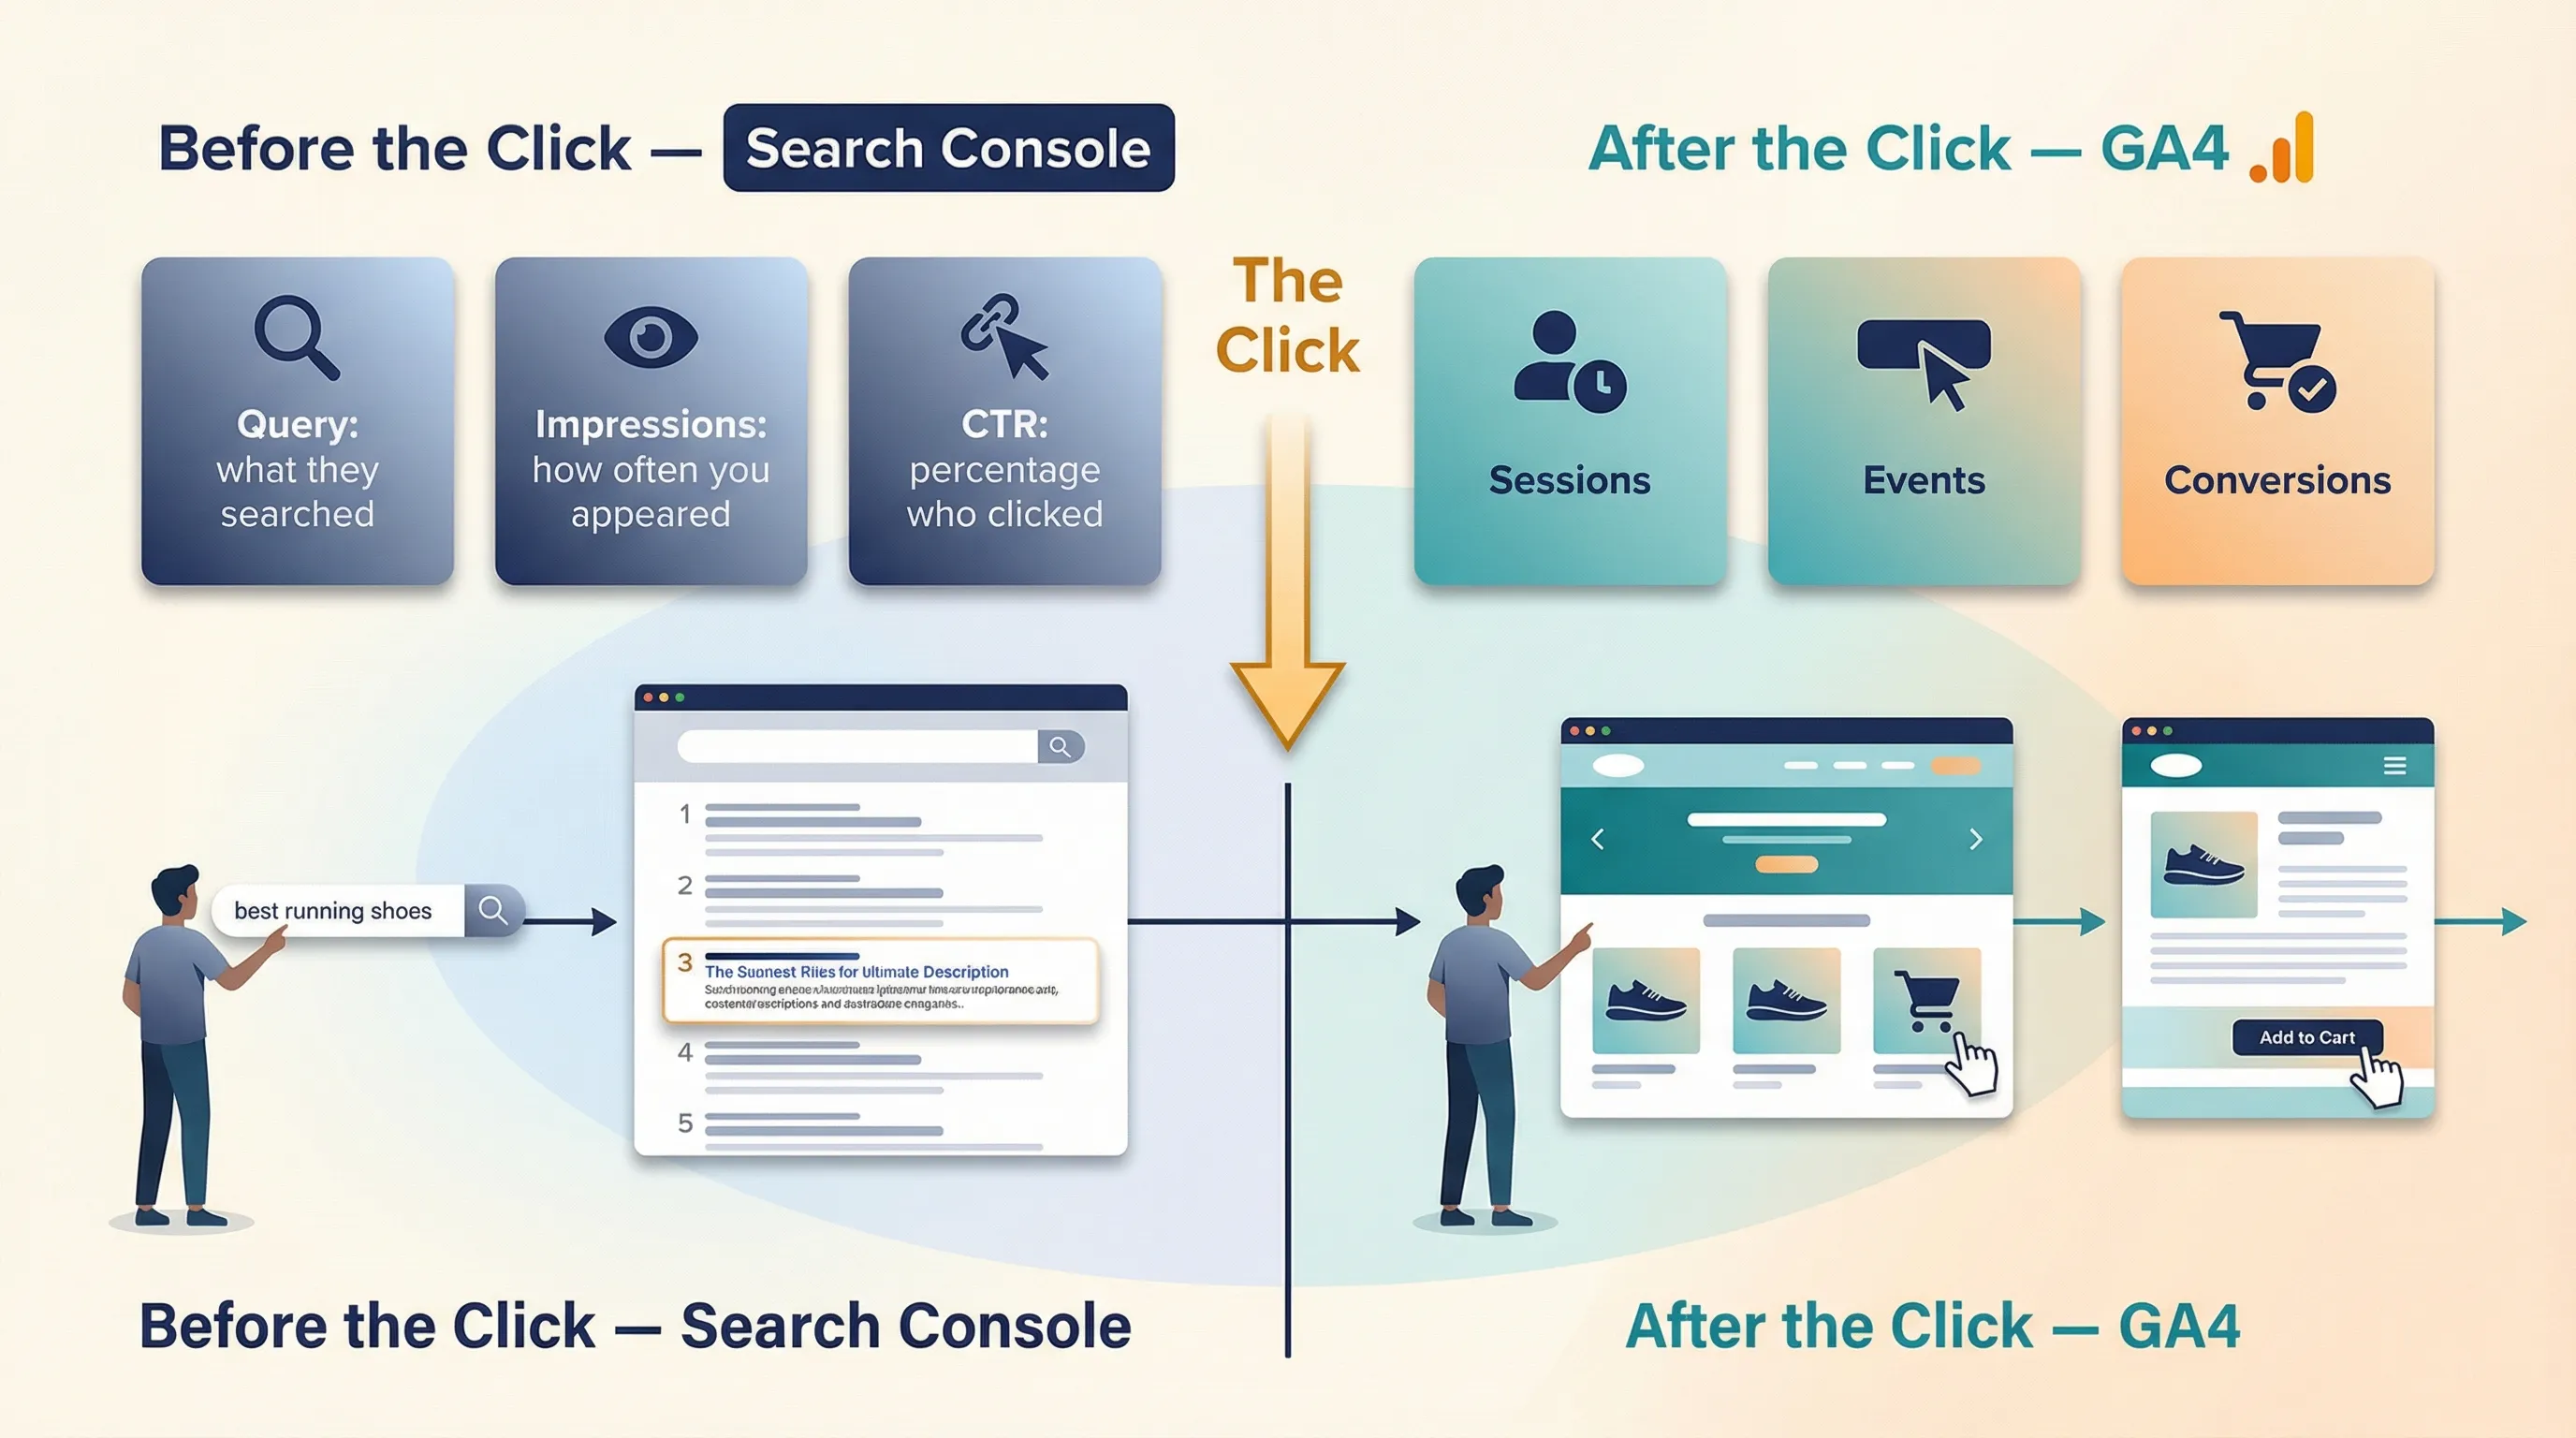
What It Does:
Google Search Console captures data about Google Organic Search that GA4 cannot: what happened before the click. It reveals the search queries users typed, how many times your site appeared in search results, your click-through rates, and your ranking positions.
What Gets Captured:
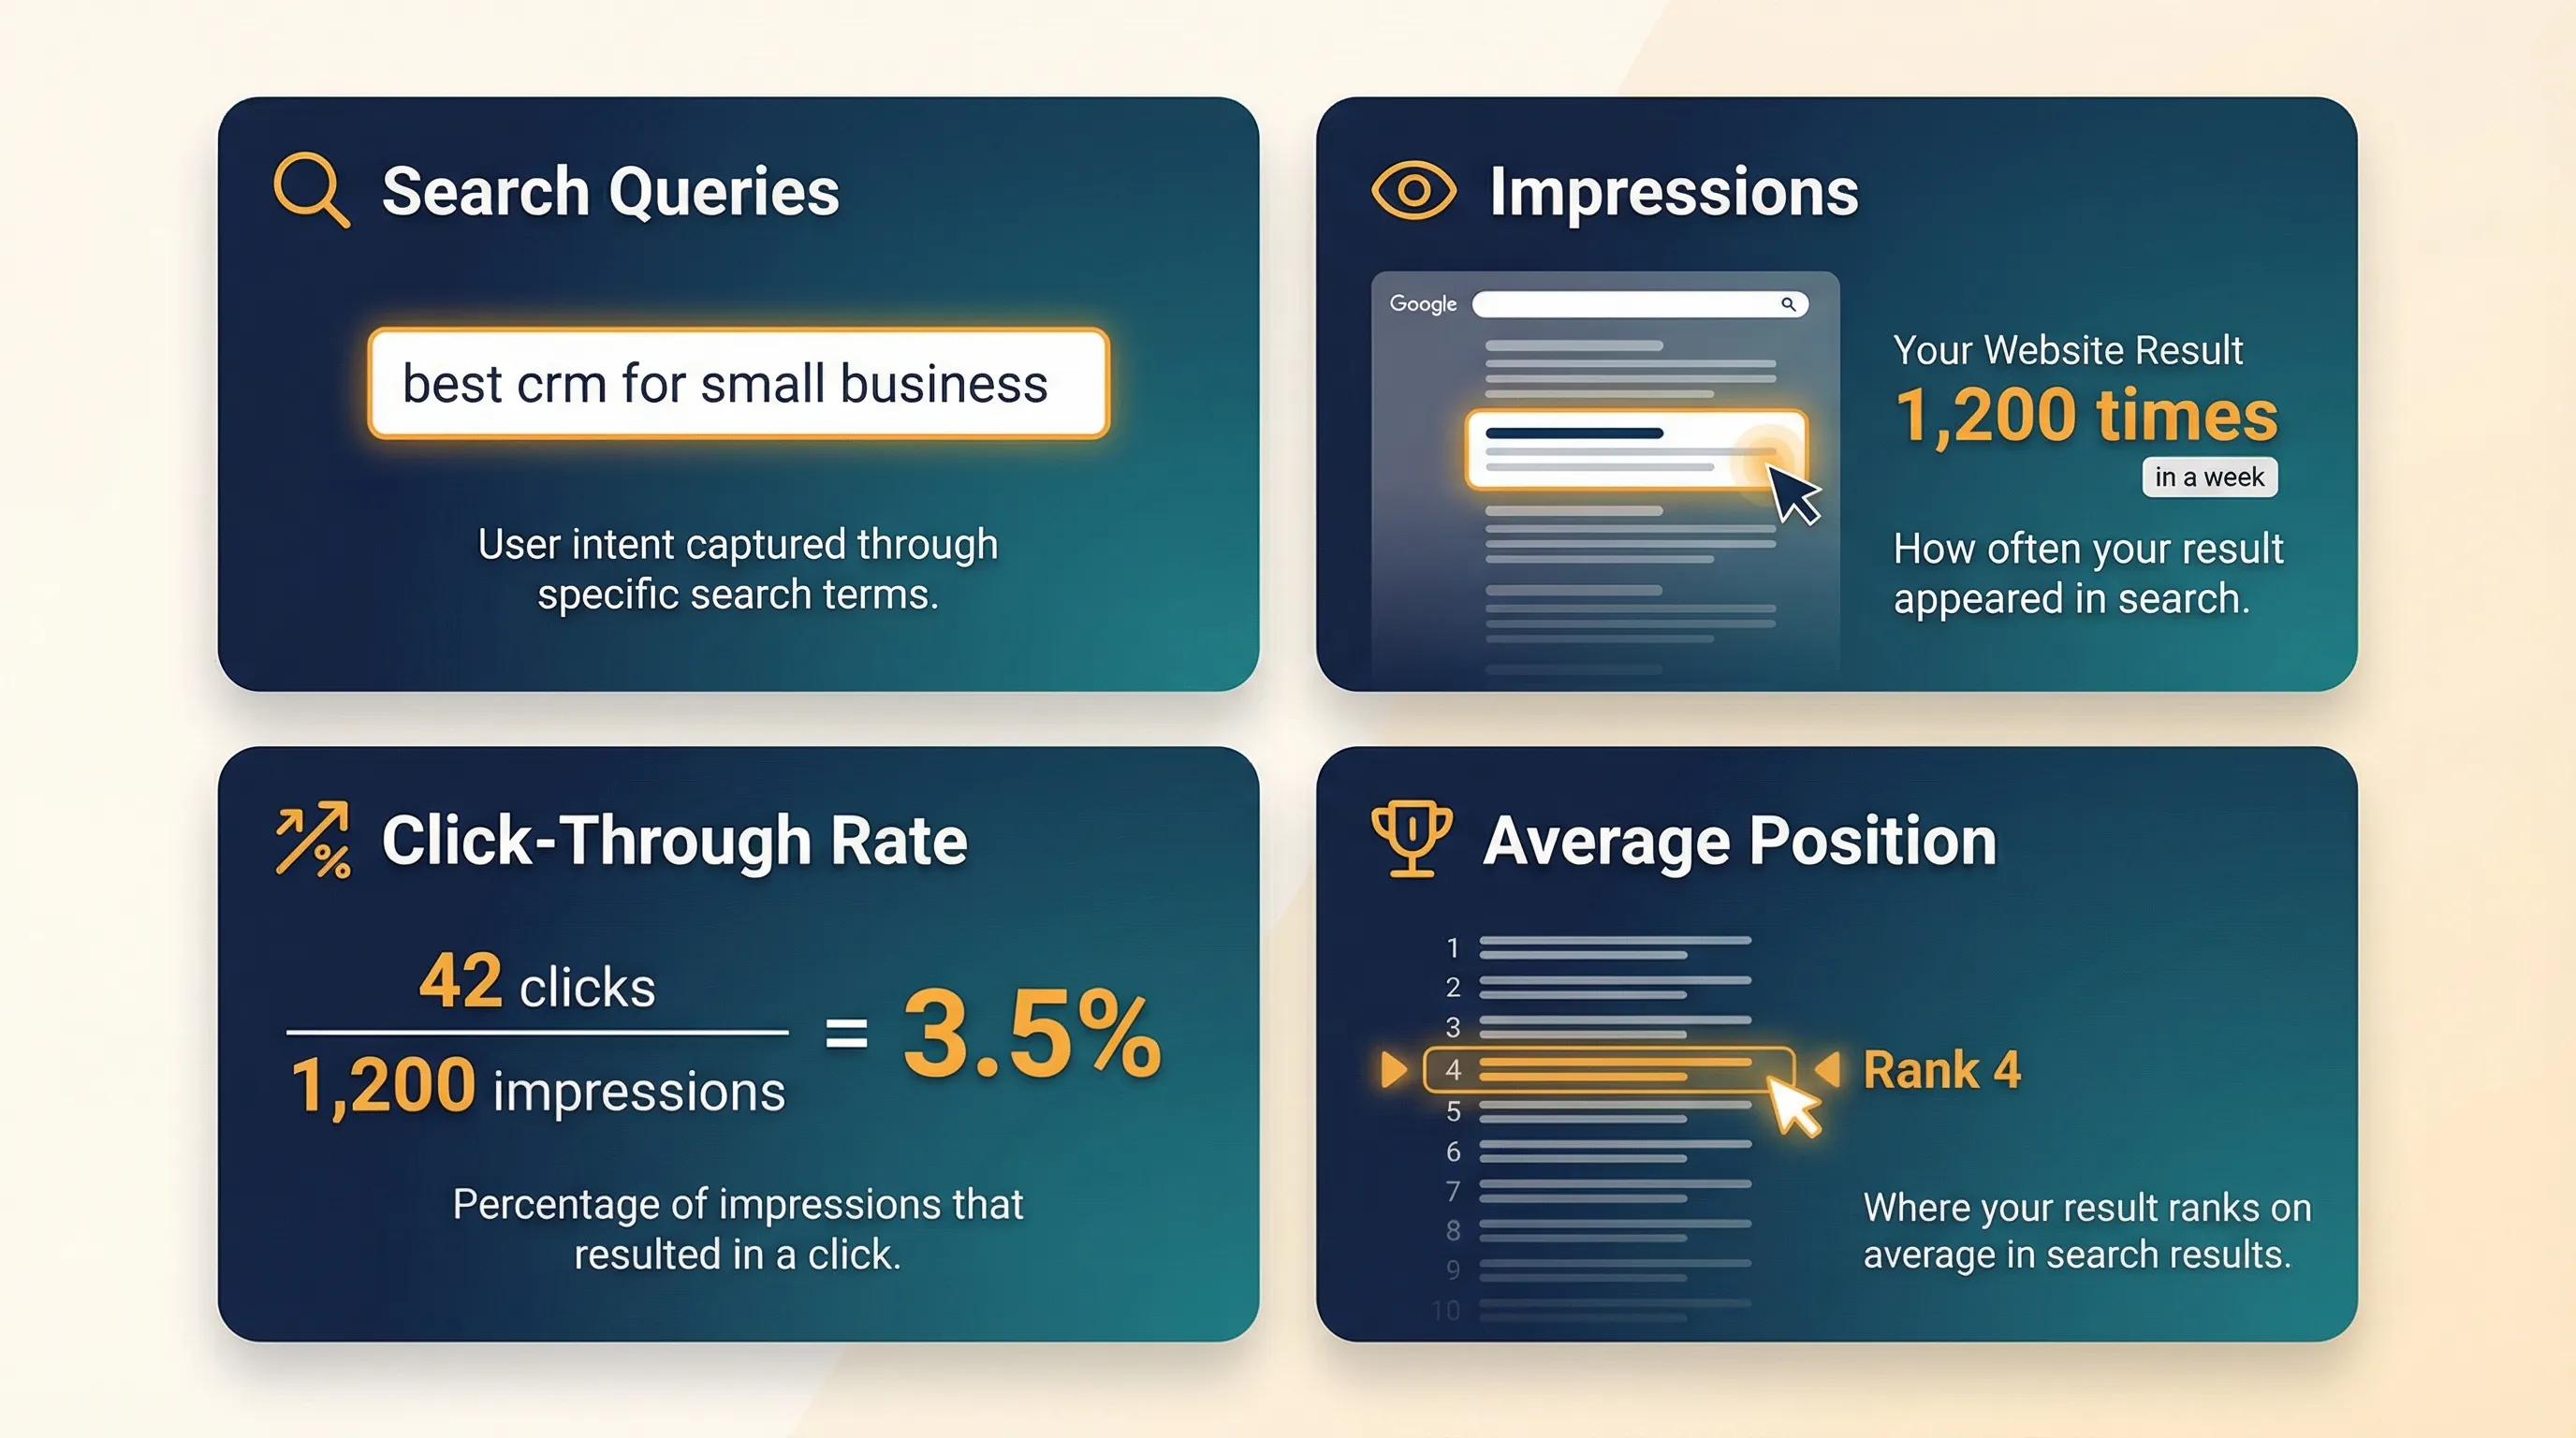
Search Queries: The exact keywords that triggered your pages in Google search results. This reveals user intent; what problems they’re trying to solve when they find you.
Impressions: How many times your pages appeared in search results, even if not clicked. This shows your potential reach.
Click-Through Rate: The percentage of impressions that resulted in clicks. Low CTR suggests your titles and descriptions don’t match search intent.
Average Position: Where your pages rank for different queries. Position 1-3 capture most clicks; position 10+ gets minimal traffic.
Why It Matters:
Paid advertising interrupts users during existing activities. Organic search represents genuine intent; users actively searching for solutions you provide. Search Console helps you understand this intent and answers critical Aware stage questions: “What search terms do people use to find businesses like ours?“
The gap between Search Console clicks and GA4 sessions often reveals critical insights. If Search Console shows 1,000 clicks but GA4 records only 700 sessions, approximately 300 visitors left before your page loaded. This typically indicates site speed problems that need immediate attention.
How It Fits:
Search Console operates independently of other tracking (it collects data directly from Google Search). However, you should link Search Console to your GA4 property to enable integrated analysis. This connection allows you to see search performance from in GA4.
Implementation:
See our guide on How to Set Up Google Search Console.
Actionable Insights/Intelligence Hub: Looker Studio
What It Does:
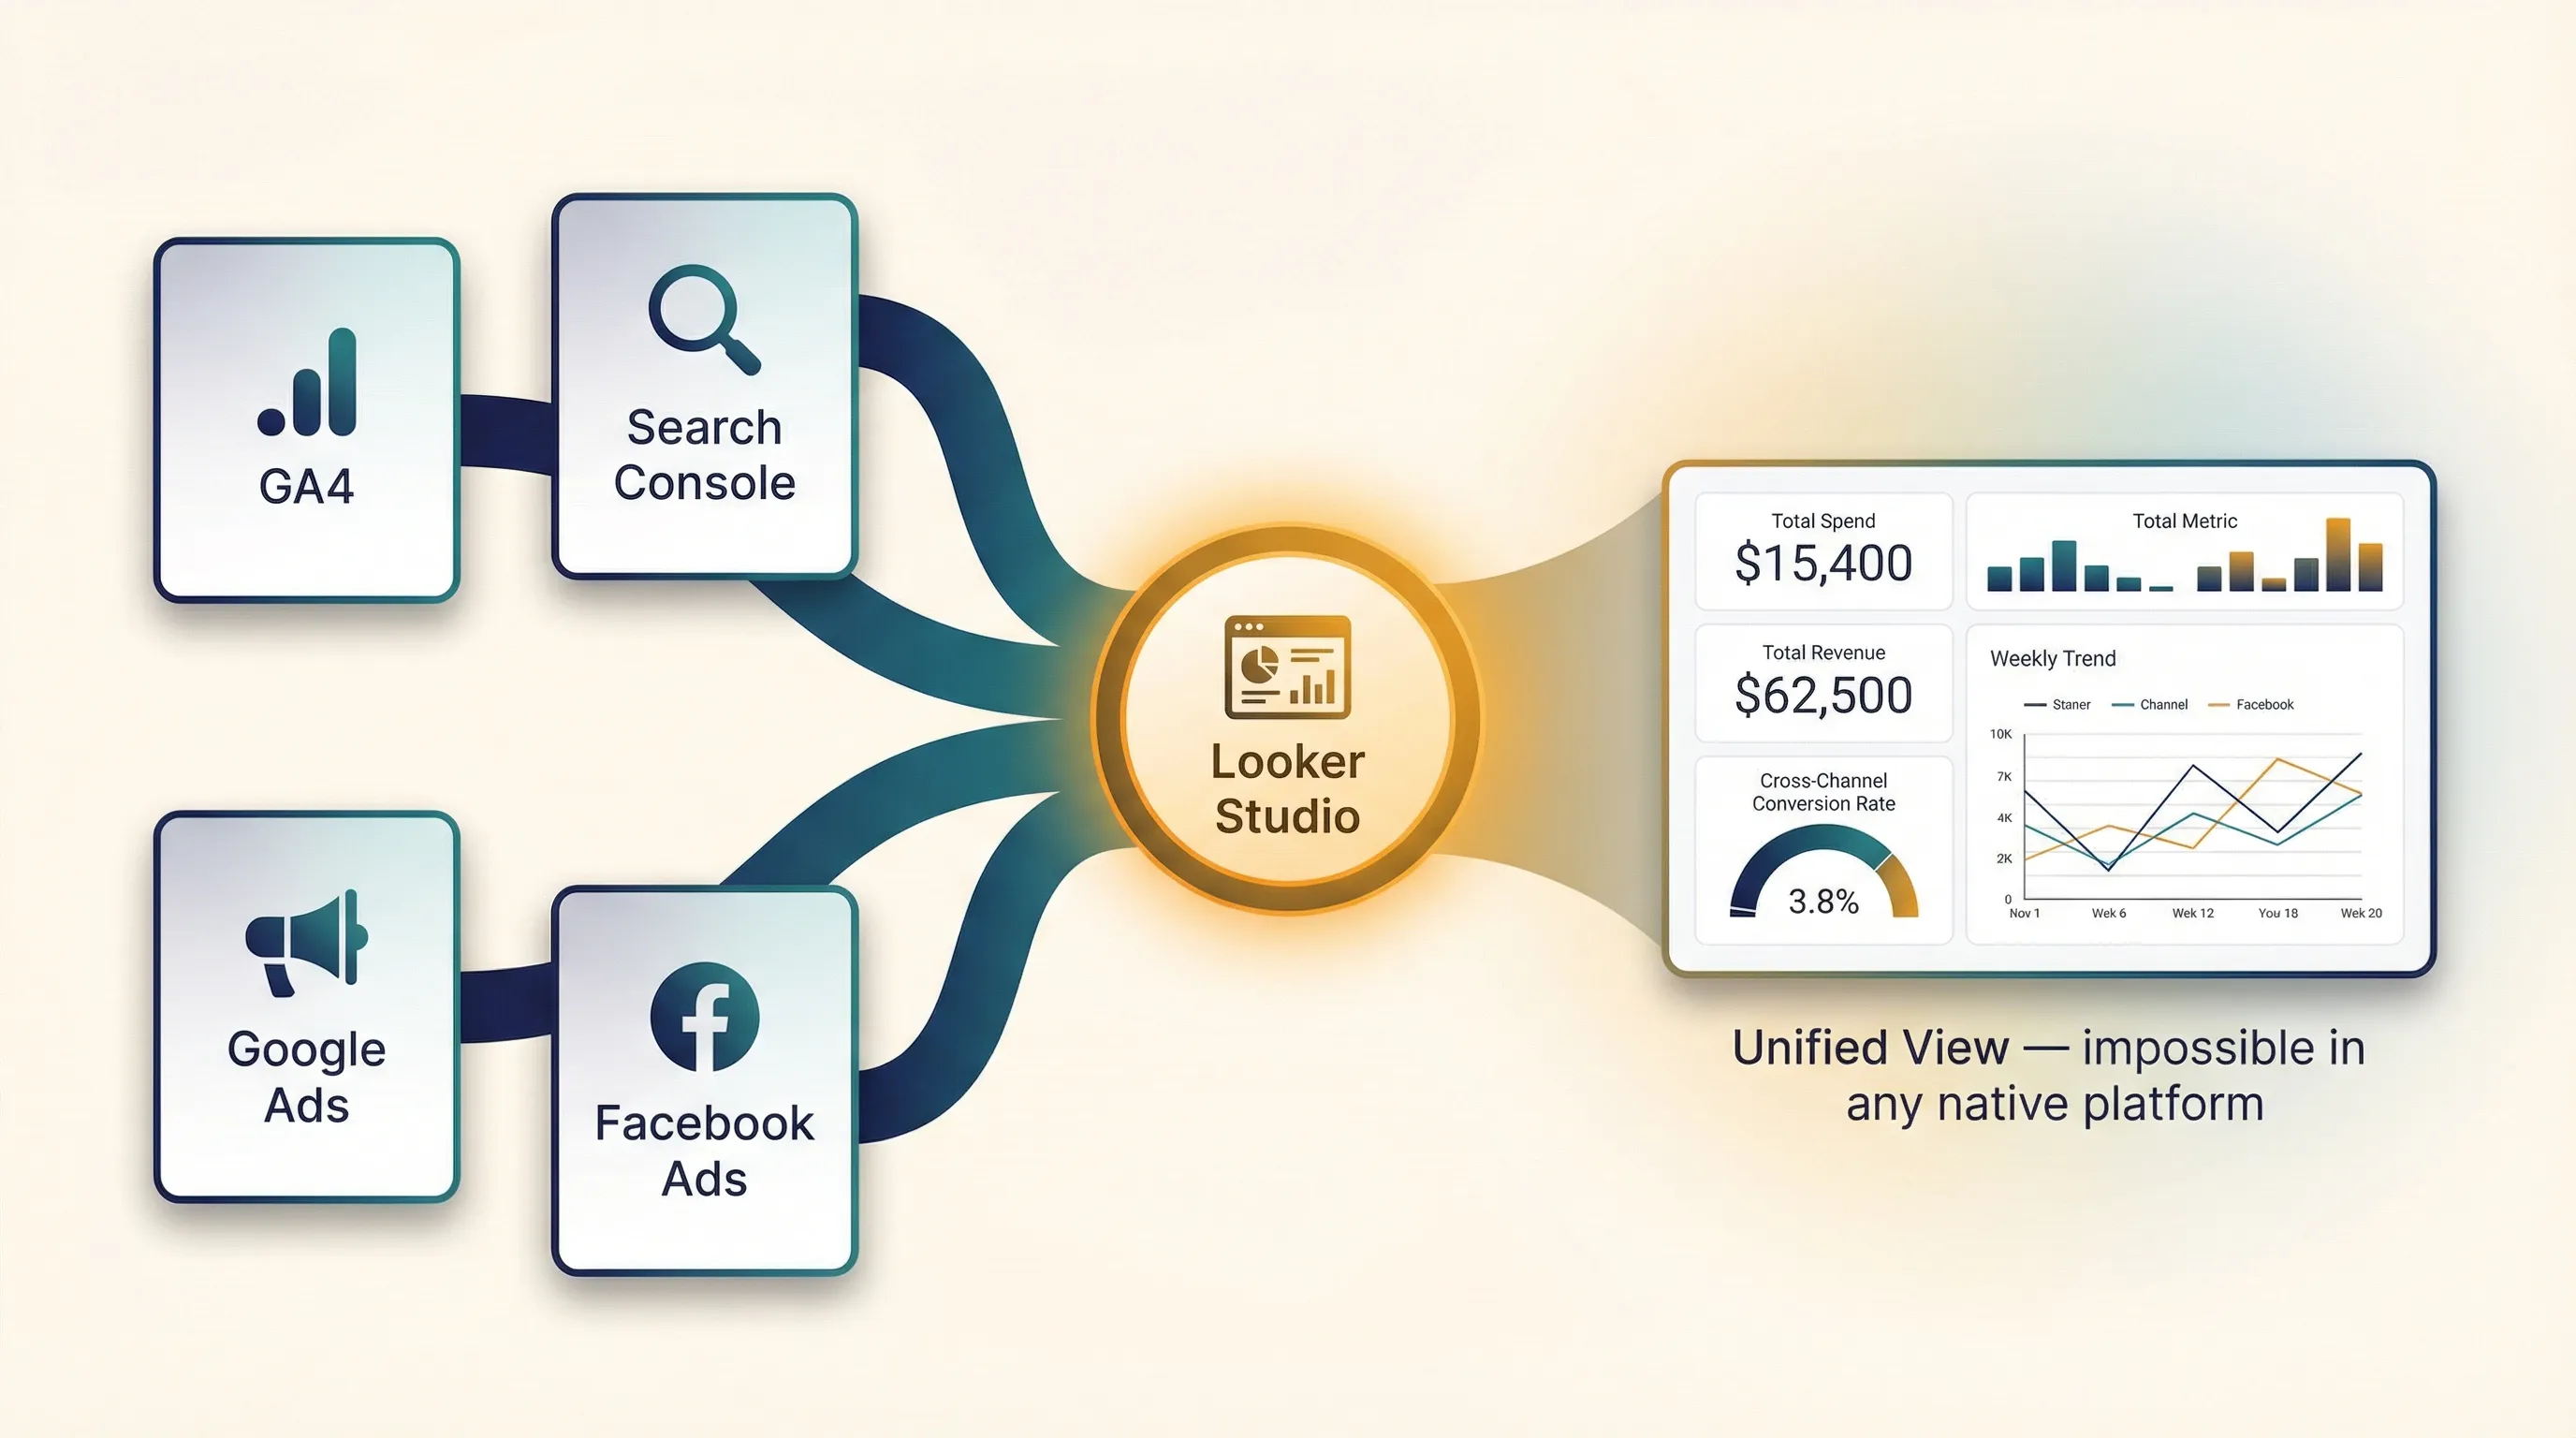
Looker Studio is a dedicated visualisation tool that doesn’t collect or own data. Instead, it connects to your other platforms (GA4, Google Ads, Search Console, Facebook Ads, etc.) via APIs and transforms that data into curated, cross-platform views that drive strategic decisions.
This is where the “Knowledge” and “Answers” part of AnD comes together. While each platform in your foundation presents its own view of data, Looker Studio can be used to more easily synthesise everything into actionable insights.
The Distinction from Other Tools:
Every platform you’ve implemented so far collects and presents its own data:
GA4collects events and presents analytics reports.Search Consolecollects search data and presents performance reports.Claritycaptures sessions and presents recordings and heatmaps.- Marketing platforms collect conversion data and present campaign performance.
Each native interface is essential for detailed, operational analysis. But strategic decision-making requires seeing everything in one place. That’s Looker Studio's purpose.
Key Capabilities:
Cross-Platform Integration: See total ad spend from Google Ads and Facebook Ads alongside total revenue from GA4 in one page. This unified view is impossible in any native platform interface.
Curated Views: Strip away hundreds of available metrics to show only what matters for your business questions. Focus on your key performance questions, ignore the noise.
Automated Reporting: Set up dashboards once, and they update automatically as new data flows in. Replace hours of manual data compilation with instant access to current metrics.
Why It Matters:
Looker Studio can be used to translate complex data into clear answers: “Are we winning or losing, and where should we focus?“
This addresses your highest-level outcome questions by presenting the complete picture: traffic sources, conversion rates, costs, and revenue all in context. You can see which marketing channels deliver the lowest cost per customer, what your return on ad spend is across all campaigns, and whether you’re on track to hit your targets.
Limitations to Acknowledge:
Looker Studio cannot replicate every native feature. GA4 path exploration, Clarity session recordings, and certain platform-specific insights must be accessed in their native interfaces. Looker Studio complements these tools rather than replacing them.
Some data also has API limitations that can affect real-time availability compared to native interfaces.
How It Fits:
Looker Studio sits at the synthesis point of your foundation. It receives processed data from all your platforms and transforms it into knowledge (effective visualisation) that produces answers (strategic insights).
Implementation:
To get Actionable Insights for Google Analytics 4, Google Ads and Search Console we created the The Actionable Google Marketing Looker Studio Template.
Actions: What Does ITDO?
The Marketing Measurement Foundation isn’t about tools or data. It’s about making better decisions that drive business outcomes. Once your implementation is complete and data flows through your foundation, you shift from implementation mode to operational mode.
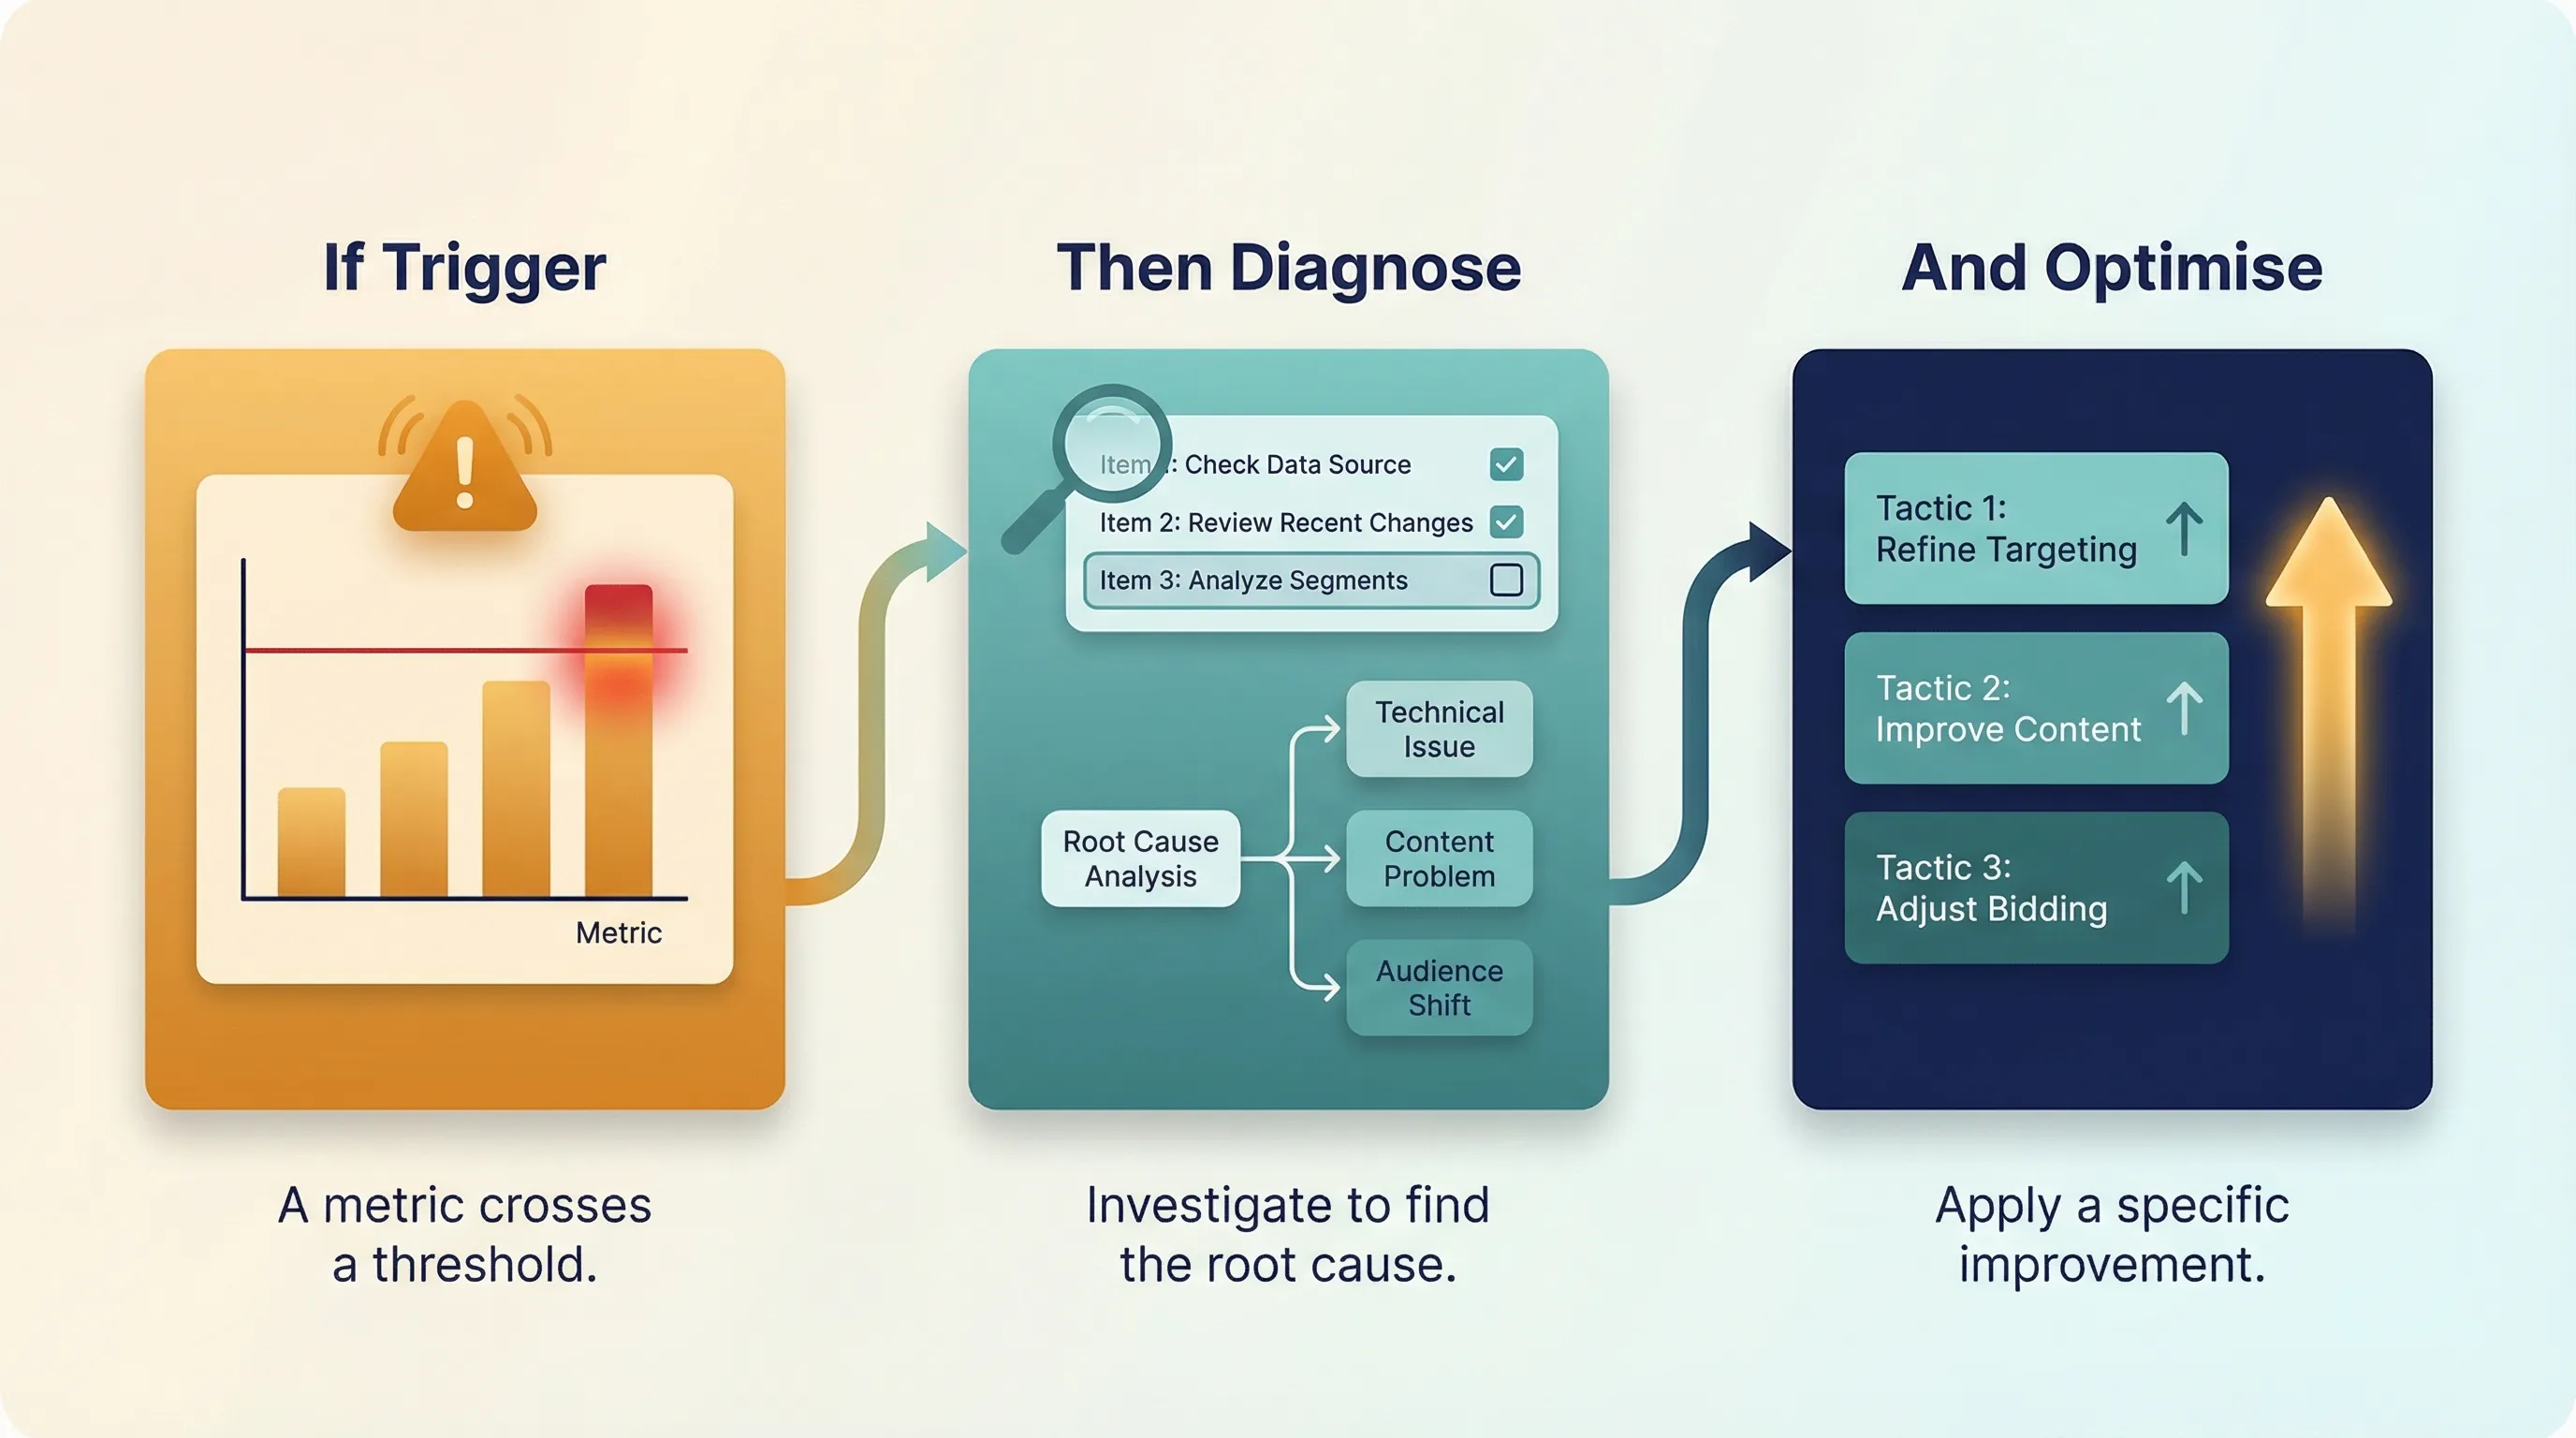
This is where the If Trigger, then Diagnose and Optimise (ITDO) framework operationalises your measurement system.
Building Your Action Protocols
For every key metric in your dashboard, define what happens when it changes significantly. This creates a self-correcting system where data automatically triggers investigation and optimisation.
Each protocol follows the same pattern: it references a Key Performance Question from earlier, identifies which tools answer that question, and takes action based on the specific answer provided.
Which traffic sources bring visitors who take time to explore what we offer? → Traffic Quality Decline Protocol:
If Average engagement time per session from paid social drops below 45 seconds (normally 2+ minutes)
Then Diagnose:
- Check
GA4traffic source reports filtered by UTM parameters (utm_medium=cpc)- Identify which specific campaign or ad set shows degraded engagement (Spring Sale campaign session duration dropped from 2:15 to 0:38)
- Check
GA4landing page report for that campaign’s destination- Verify which landing page receives this traffic and its
Average engagement time per session.
- Verify which landing page receives this traffic and its
- Check
Clarityheatmaps for landing pages from that campaign- Determine if landing page content doesn’t match ad promise or if ad targeting is attracting wrong audience (users not scrolling, immediately exiting)
And Optimise:
- Review ad copy and landing page alignment (does ad promise match landing page content?)
- Test new audience targeting (current audience may not match ideal customer profile) or creative variation (ad message may attract wrong users)
- Monitor UTM-tagged traffic quality in
GA4for next 72 hours to verify improvement
Why This Works: Average engagement time per session and engagement are behaviour indicators that predict conversion quality. Poor engagement from a traffic source signals lead quality problems before they impact conversion rates or revenue. Early intervention prevents waste and protects budget.
What search terms do people use to find businesses like ours? → Search Traffic Decline Protocol:
If Organic search clicks in Search Console drop 20% week-over-week
Then Diagnose:
- Check
Search Consoleperformance report filtered to last 28 days compared to previous period- Identify which specific queries lost impressions or ranking position (primary product query dropped from position 3 to position 9)
- Check
Search Consolecoverage report for indexing issues or errors- Determine if technical SEO issue (pages deindexed, crawl errors) or content ranking drop (competitor content outranking yours)
- Check
GA4landing page report for affected pages to see historical conversion rates- Verify if traffic loss affects high-converting pages (this page converts at 4.2% vs site average 2.1%)
- Cross-reference with
GA4to see if remaining traffic from these queries still converts well- Confirm whether problem is visibility (fewer people see you) or relevance (wrong audience finding you)
And Optimise:
- If technical issue: Fix indexing errors, crawl blocks, or broken internal links immediately
- If ranking drop: Review and update affected content (add recent information, improve comprehensiveness, strengthen relevance to query intent)
- If high-converting pages affected: Prioritise recovery efforts on pages that historically drive most valuable traffic
- Monitor
Search Consoleposition and click data for next 14 days to track recovery progress - Verify in
GA4that returning traffic maintains historical conversion rates
Why This Works: Search visibility is a behaviour indicator for the Aware stage. Drops in impressions, position, or clicks predict traffic volume and quality problems before conversion or revenue impacts materialize. Early detection allows recovery before significant business impact.
The Self-Correcting System
Your Looker Studio dashboard shows you the score. Your ITDO protocols tell you exactly what to investigate and what levers to pull. You’re no longer guessing. You’re systematically improving performance based on empirical evidence.
This is the complete loop:
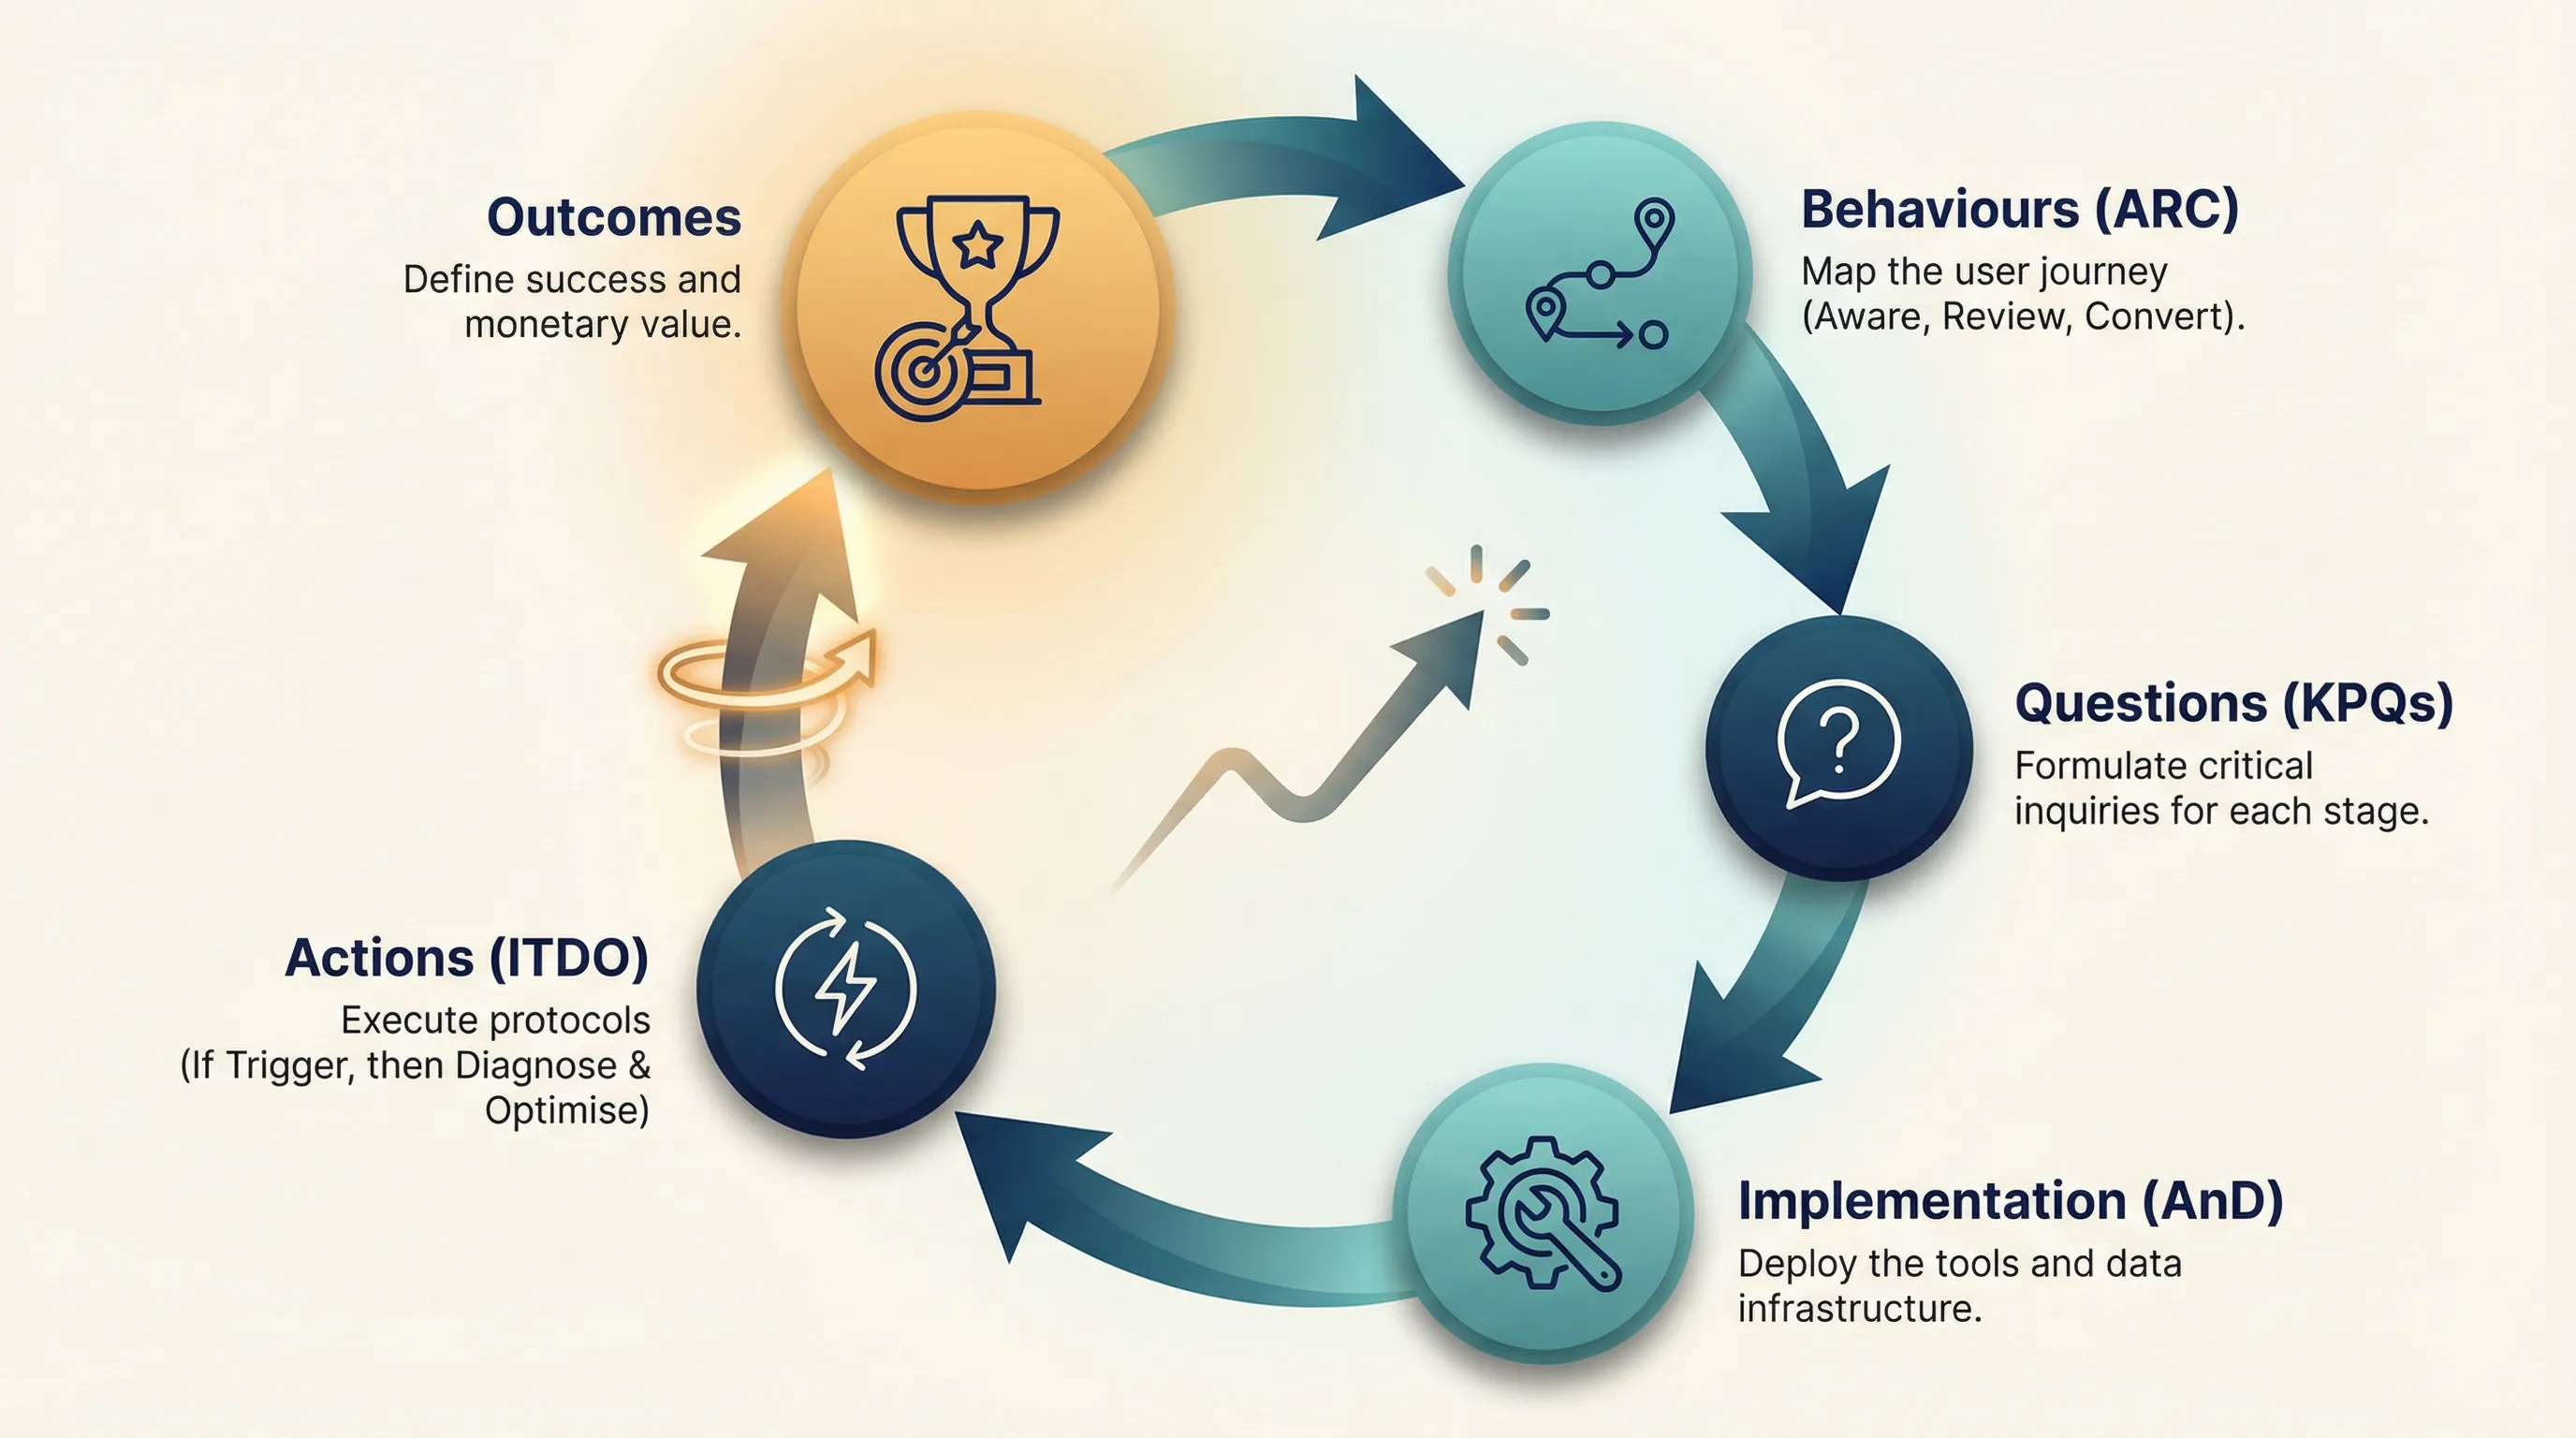
- Outcomes → You defined what success looks like (revenue growth, qualified leads, customer retention)
- Behaviours → You mapped the actions that create those outcomes (ARC framework)
- Questions → You identified what you need to know (KPQs for each stage)
- AnD (Implementation) → You implemented the tools that answer those questions reliably
- Actions → You built protocols that turn answers into optimisation
The Marketing Measurement Foundation makes this loop operational. Without it, you’re operating on intuition. With it, you’re operating on evidence.
Next Steps: From Understanding to Implementation
If you’re starting from scratch, implement in this order:
Google Tag Manager(if your platform supports it)Google Analytics 4(with event tracking)UTM parameters. Start these immediately if you’re running paid ads. Attribution data is not back-dated, so every day without UTM tagging is lost.- Conversion tracking. Same urgency as UTMs if you’re running paid ads. Ad platforms learn from every conversion signal; that learning cannot be recovered.
Microsoft ClarityConsent ModeGoogle Search ConsoleLooker Studio
Each tool in this list depends on the one before it. GTM must be in place before you can deploy GA4 events. GA4 events must be firing correctly before conversion tracking makes sense. Work through the sequence and use the implementation guides linked in each section above.
Your Implementation Options
Self-implementation. Every tool covered in this guide has a detailed implementation guide linked in its section. The guides provide step-by-step technical instructions for each component. Implementation requires precision: tracking configurations, Data Layer structures, event naming conventions, and cross-platform integrations must work together correctly.
Professional implementation. If you prefer expert setup with guaranteed results, professional implementation ensures your foundation is built correctly from the start. This includes complete setup from GTM installation through Looker Studio dashboard configuration, with proper Data Layer implementation, event tracking, conversion tracking across all platforms, and integrated reporting.
Our Google Analytics Consulting Services provide done-for-you foundation implementation.
Conclusion: From Blindness to Clarity
You now understand the Marketing Measurement Foundation, not as a collection of tools, but as a systematic approach to answering business questions with data.
The methodology is clear: define outcomes, map behaviours, formulate questions, then implement the tools that answer those questions. Each tool exists because it provides specific data, analysis, or intelligence you cannot get without it. The Data Layer provides structure. GTM provides deployment flexibility. GA4 tracks behaviours and processes analytics. Clarity explains user experience. UTM parameters enable attribution. Conversion tracking enables optimisation. Consent Mode enables compliant measurement. Search Console reveals intent. Looker Studio synthesises everything into actionable intelligence.
The transformation isn’t technical; it’s strategic. You shift from accepting whatever data analytics tools provide by default to actively deciding what you need to measure and building the infrastructure to measure it precisely.
The implementation guides are linked throughout this article. The methodology is proven. The only question remaining is when you’ll stop operating blind and choose to see clearly.