If you’re a business owner or marketer, you’ve likely opened Google Analytics 4, stared at the dashboard, and thought: “What am I supposed to look at first?” The overwhelming array of reports, metrics, and charts makes it nearly impossible to find simple answers to basic questions like “Is my marketing actually working?” or “What should I focus on to grow my business?”
The challenge isn’t that GA4 lacks data. It’s that without knowing what to look at first, all that data becomes noise rather than insight. You end up with numbers but no answers, reports but no direction, and dashboards that create more confusion than confidence.
This guide solves that problem with a questions-first approach. Instead of trying to learn every feature or memorise every report location, you’ll start with the handful of critical questions that matter most for small and medium-sized businesses (SMBs) that can be answered by just one standard report. By the end, you’ll have a clear, repeatable process for turning GA4 data into confident decisions that drive growth.
Table of Contents
Why These Questions? Understanding the User Journey Behind Our Question Selection
Google Analytics 4 contains numerous reports. When you first open it, the natural instinct is to try to understand everything. But here’s the truth: you don’t need to learn all of GA4. You need to answer the right questions for your business.
This questions-first approach is a core part of The Actionable Measurement Framework, a system for transforming analytics from overwhelming dashboards into clear sources of strategic insight. The Framework’s core principle is simple: start with your business strategy and the questions that matter, then let those questions guide what you measure.
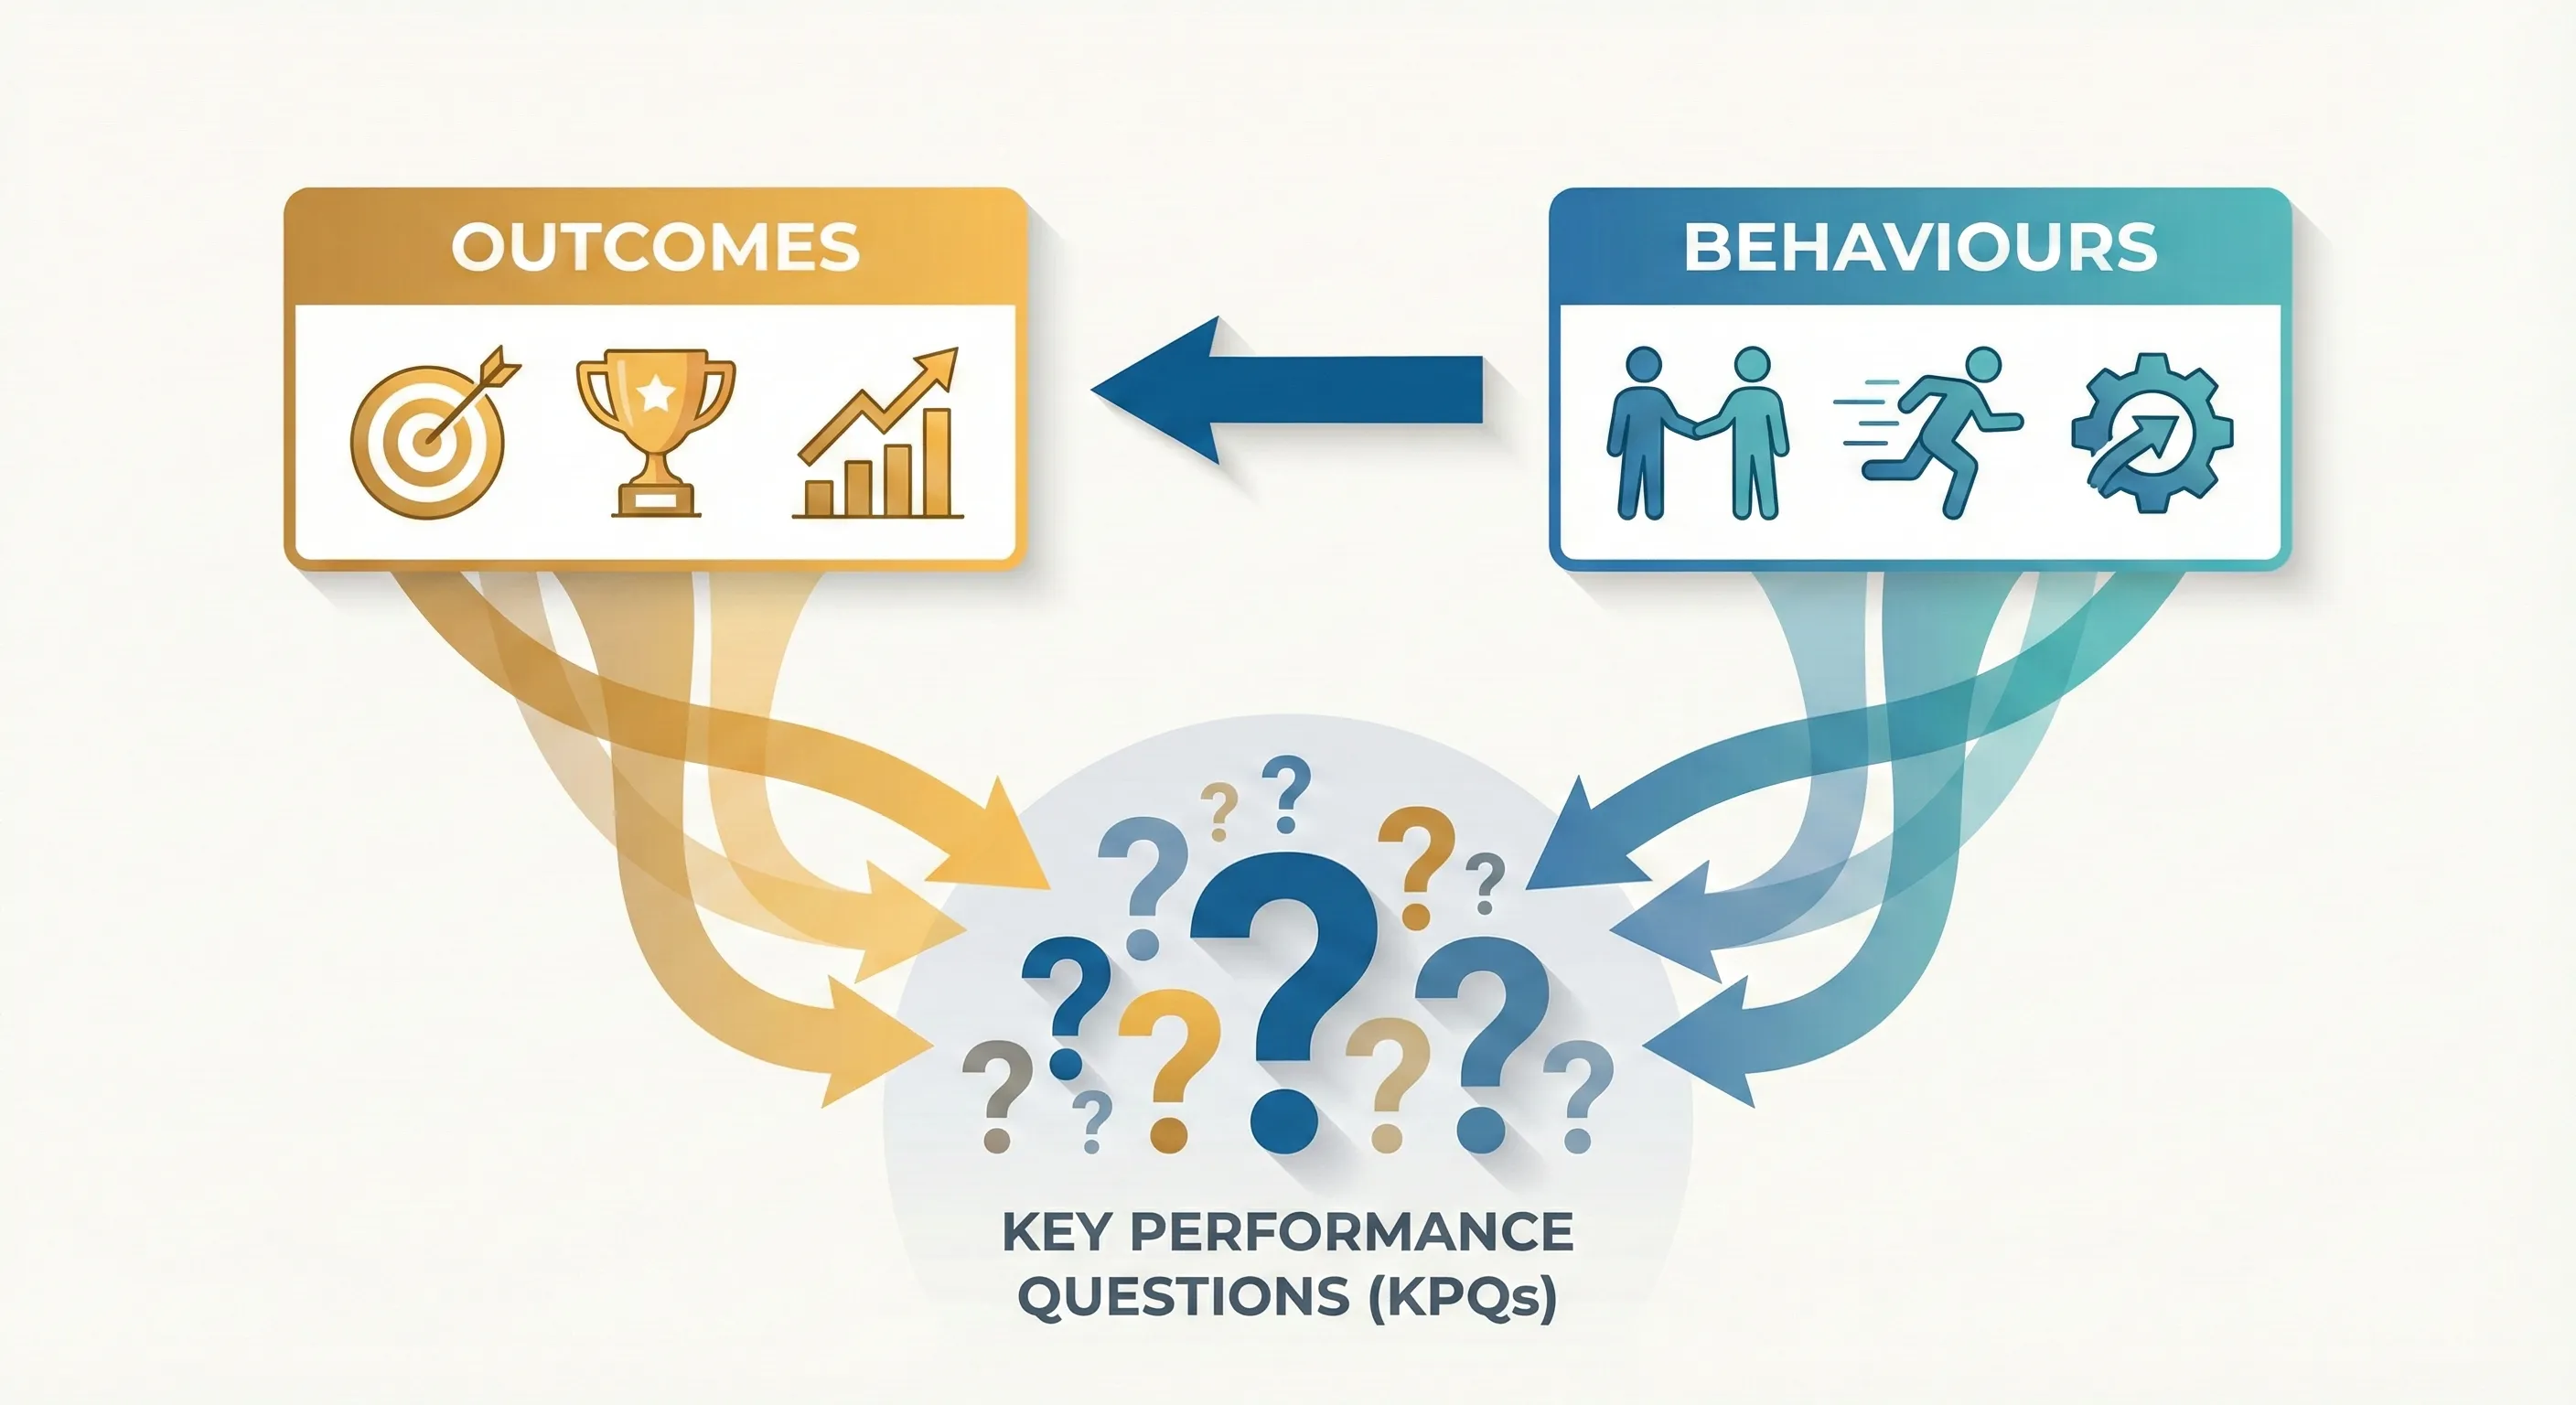
So how do we know which questions are the “right” ones? Good questions come from understanding two things: what you want to achieve (revenue, leads, growth, etc.) and how users behave to create those outcomes. This connection between desired outcomes and user behaviours is the foundation of effective measurement.
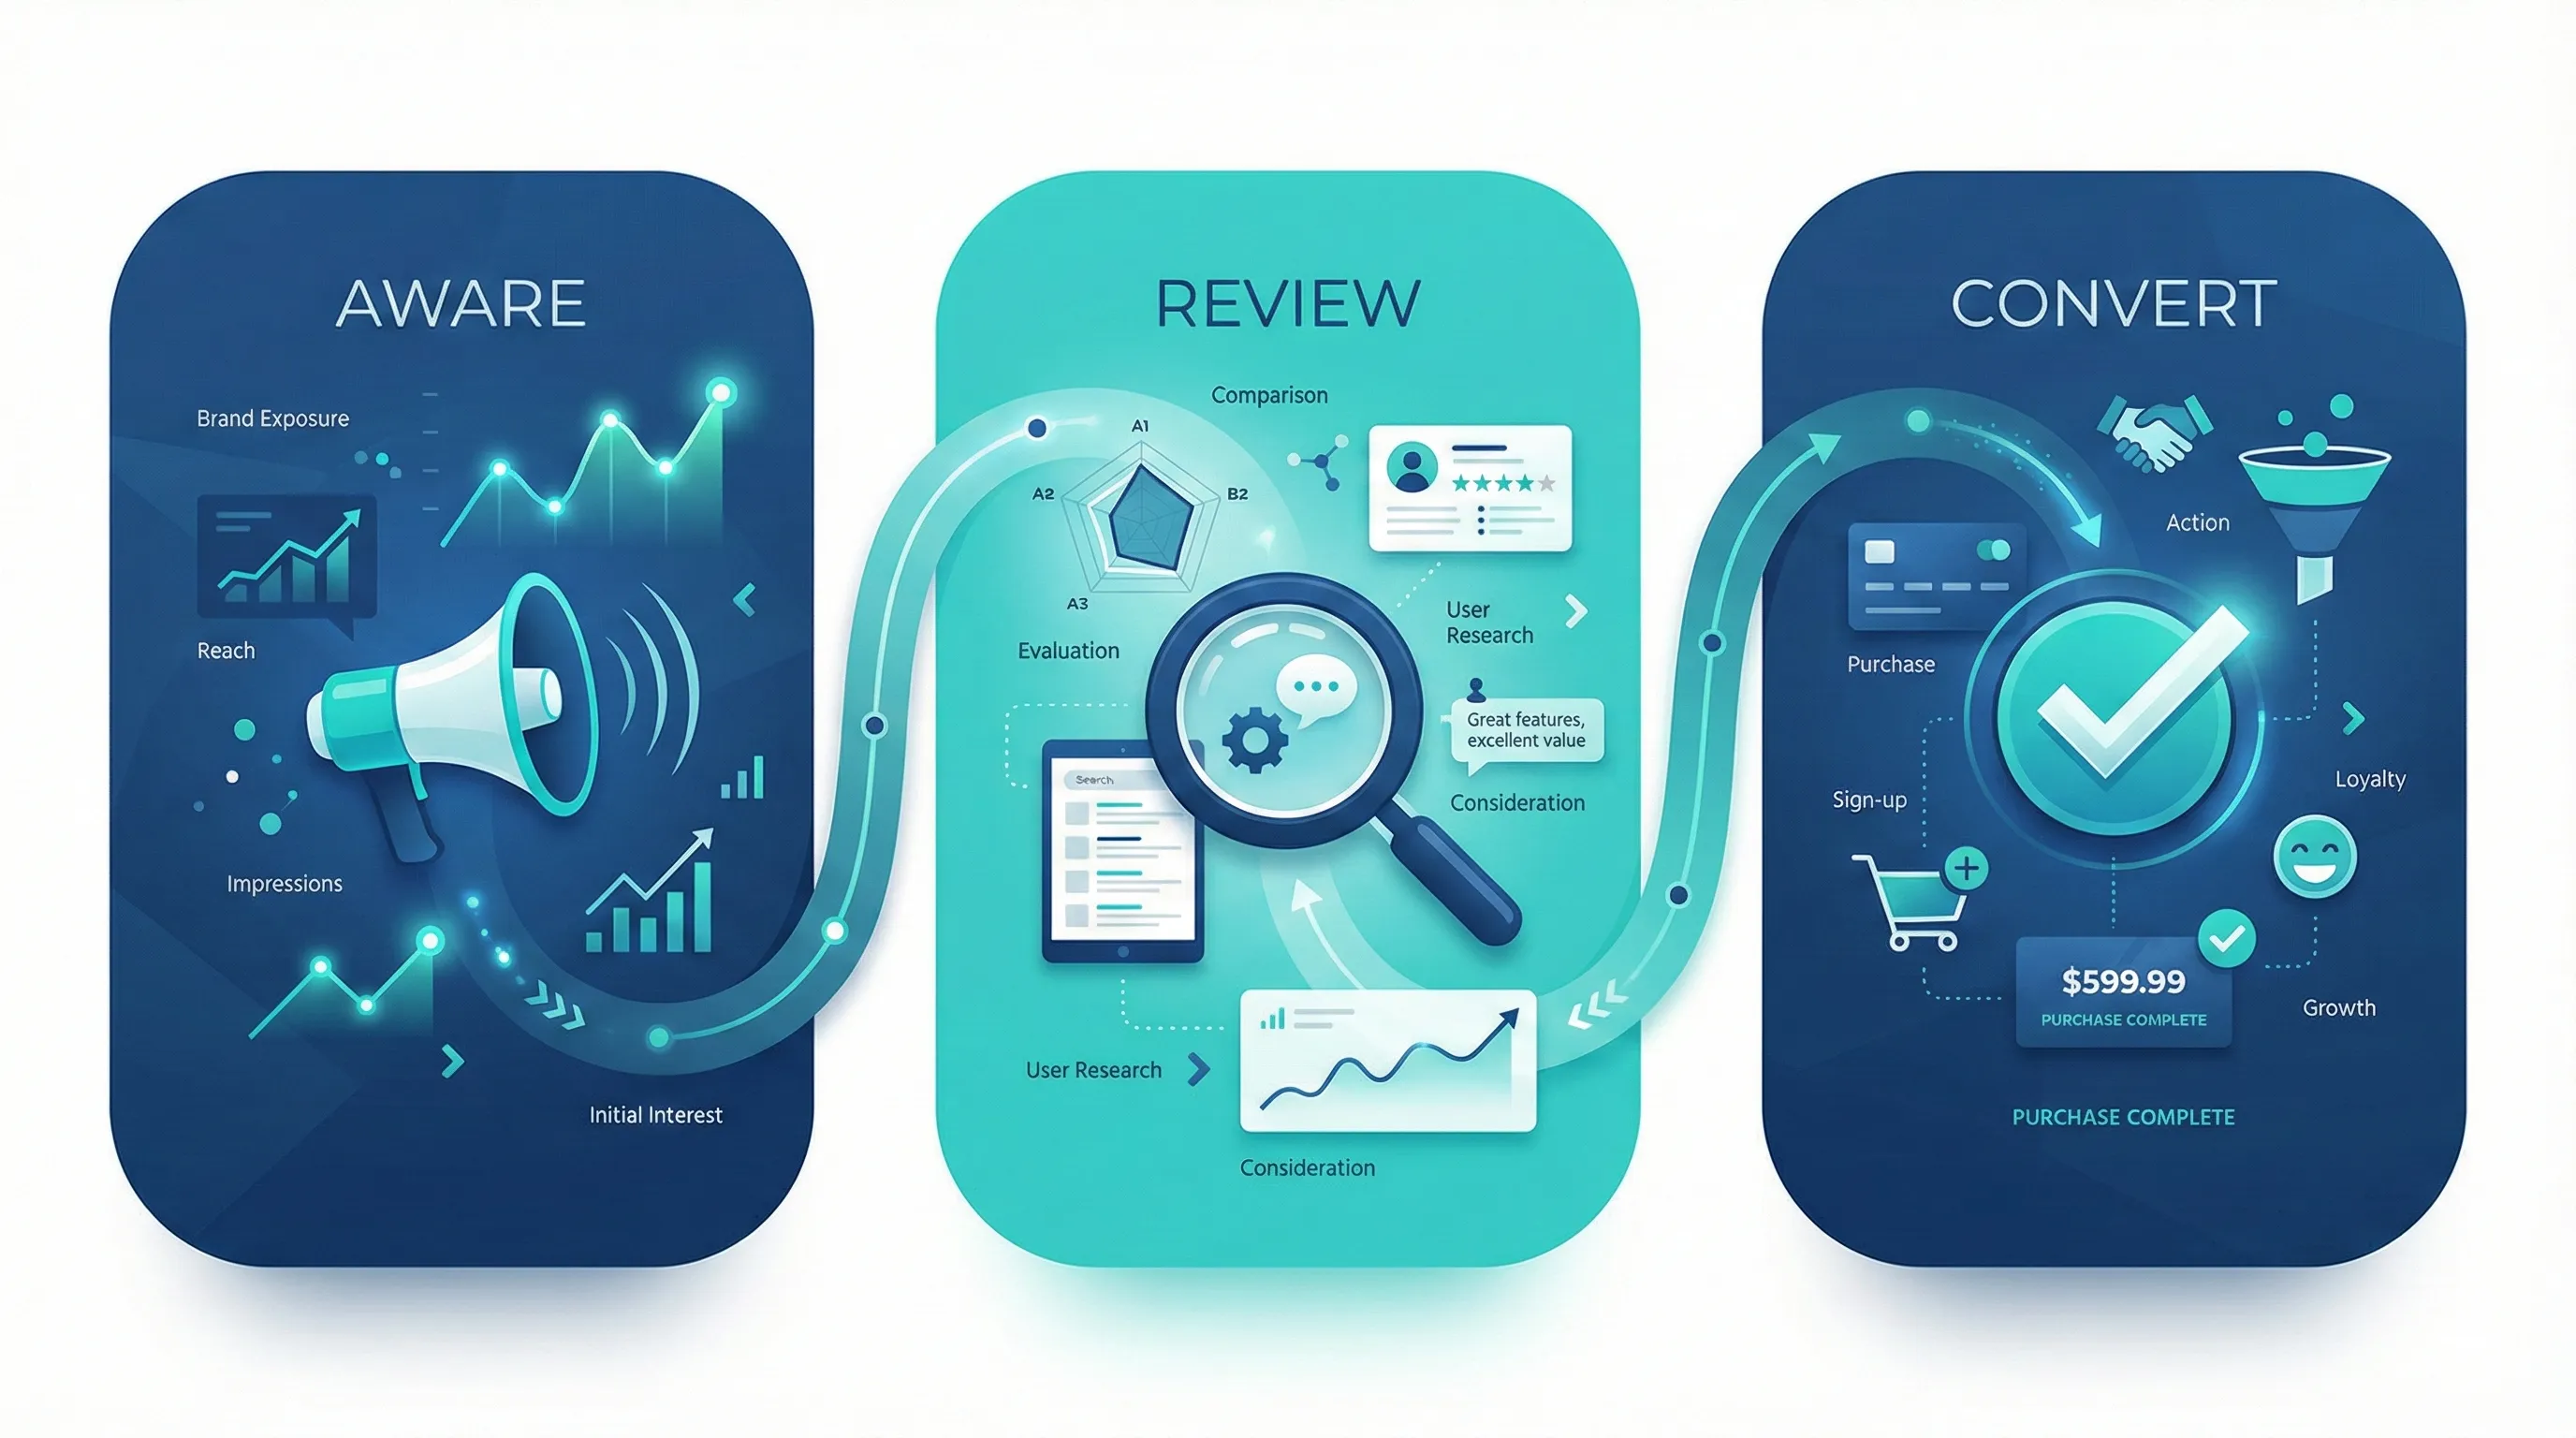
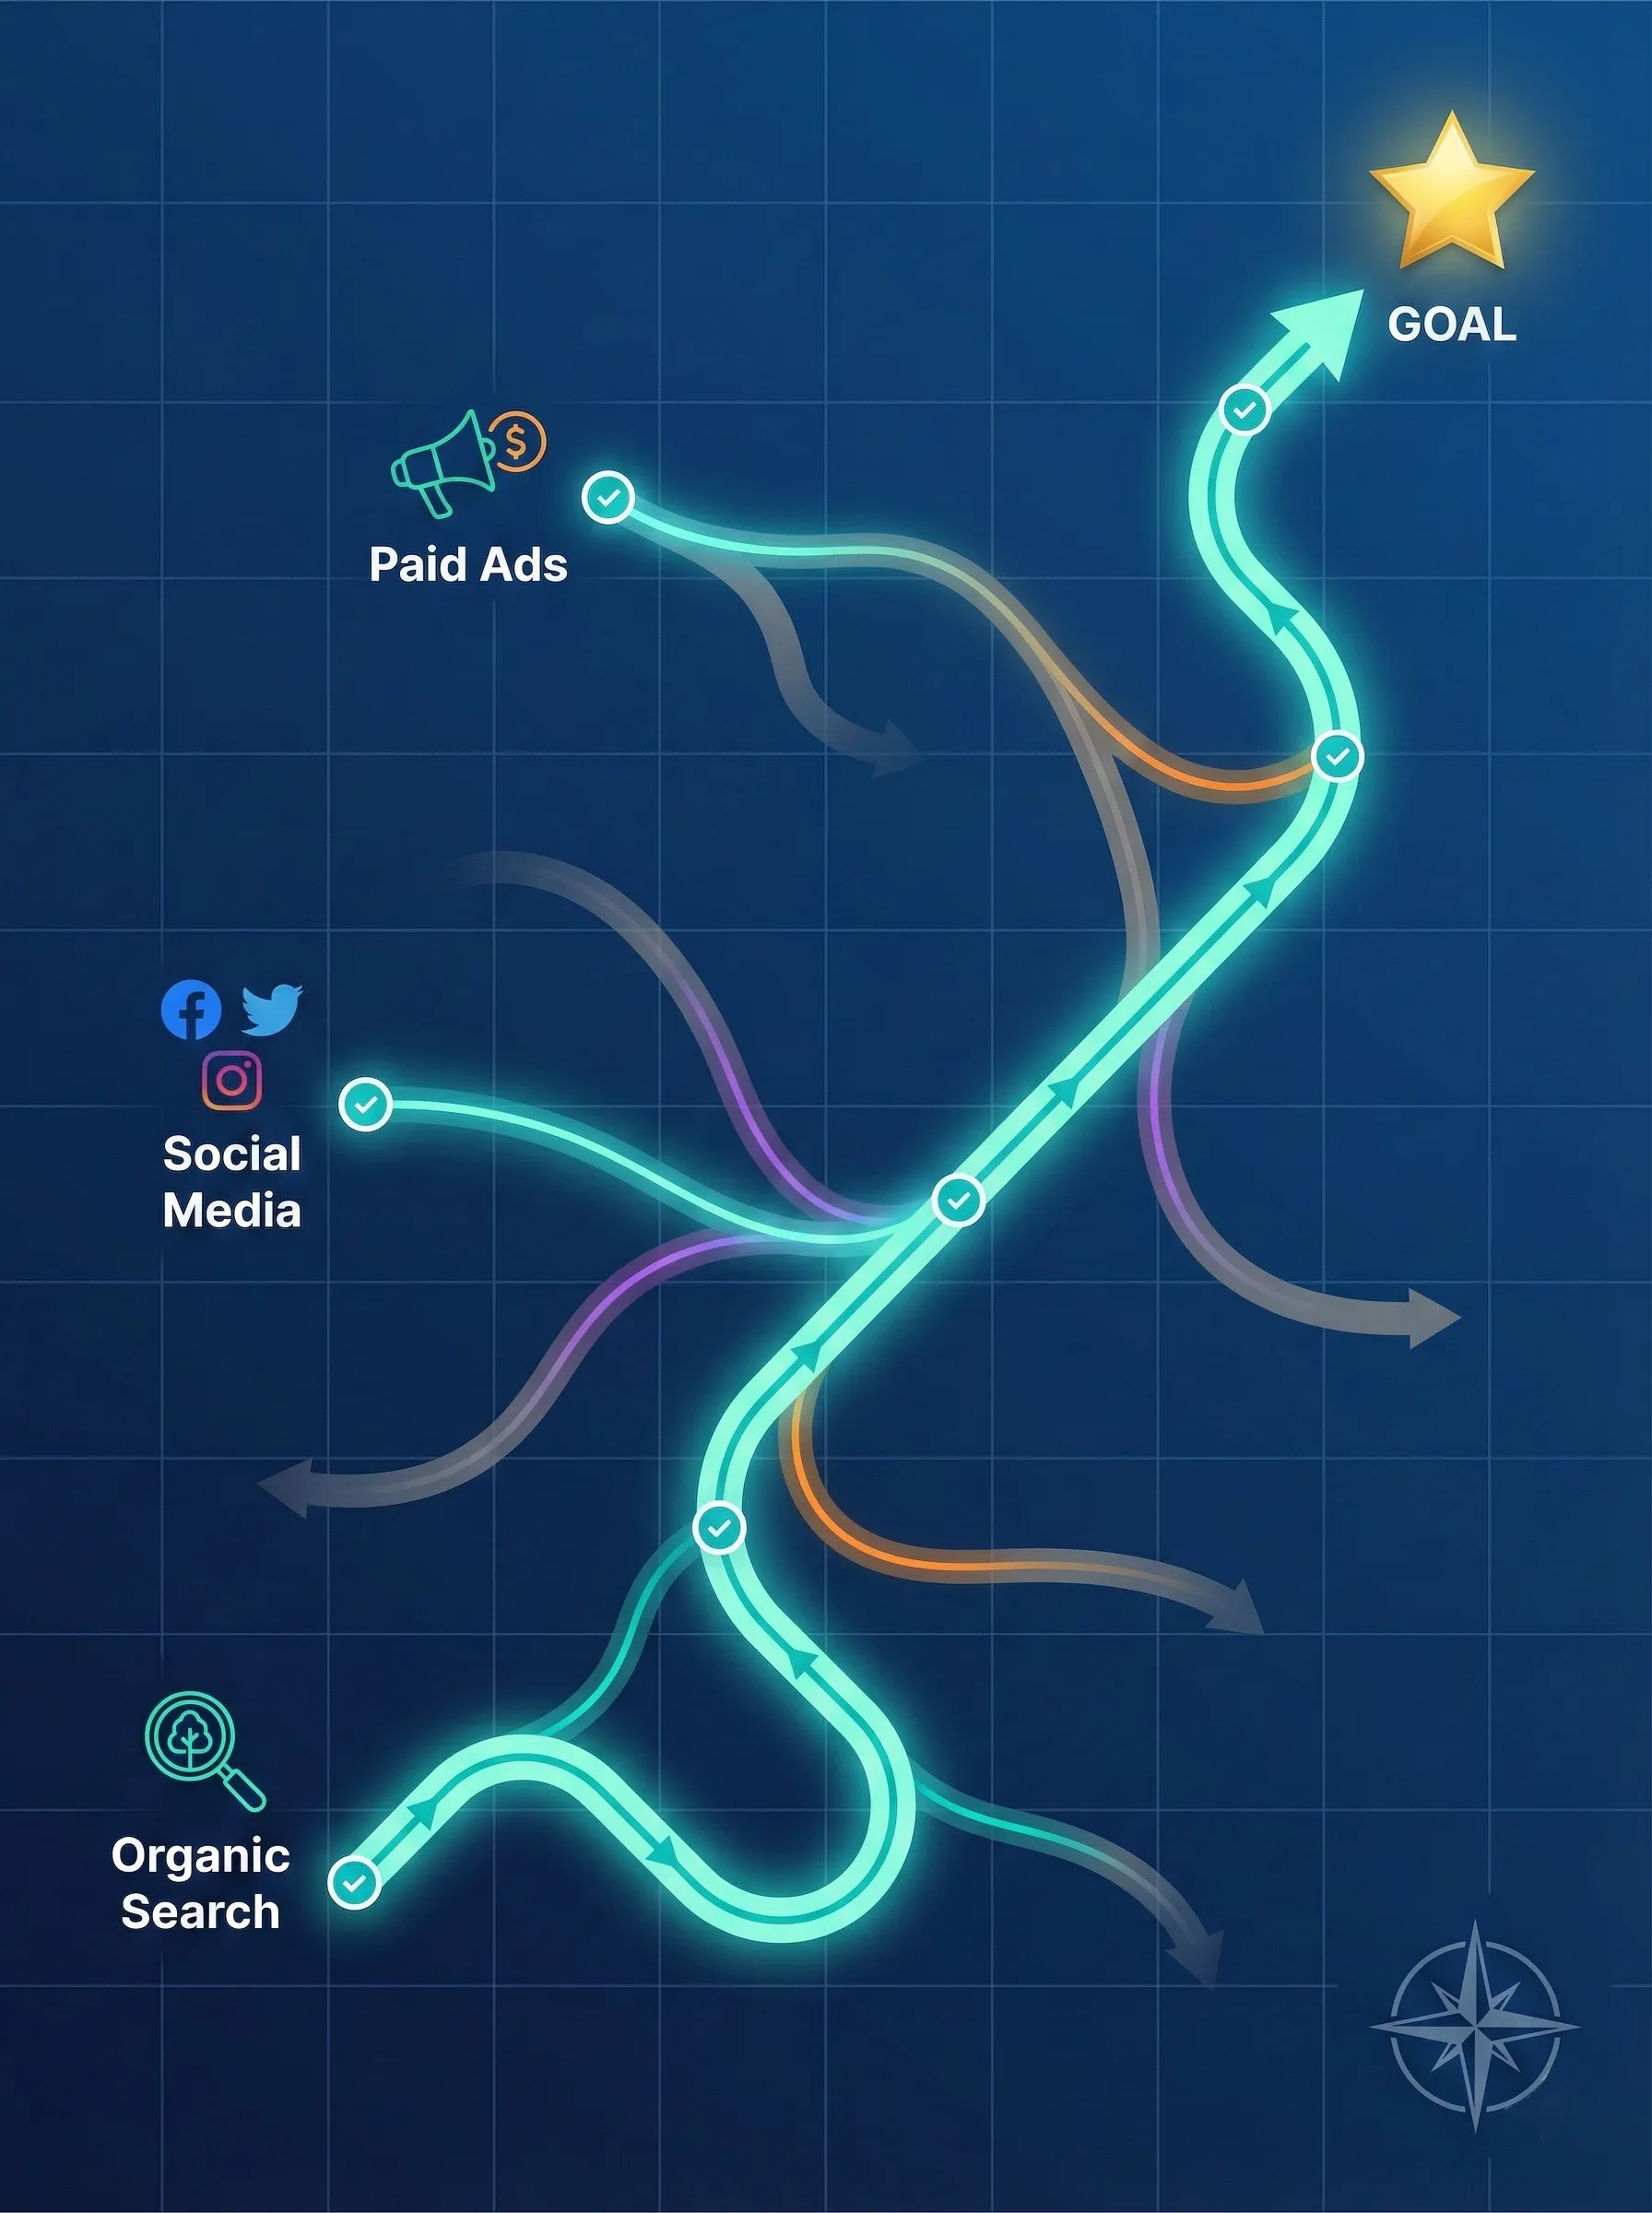
For web businesses, user behaviour follows a journey that we can map and measure. This journey has three core stages:
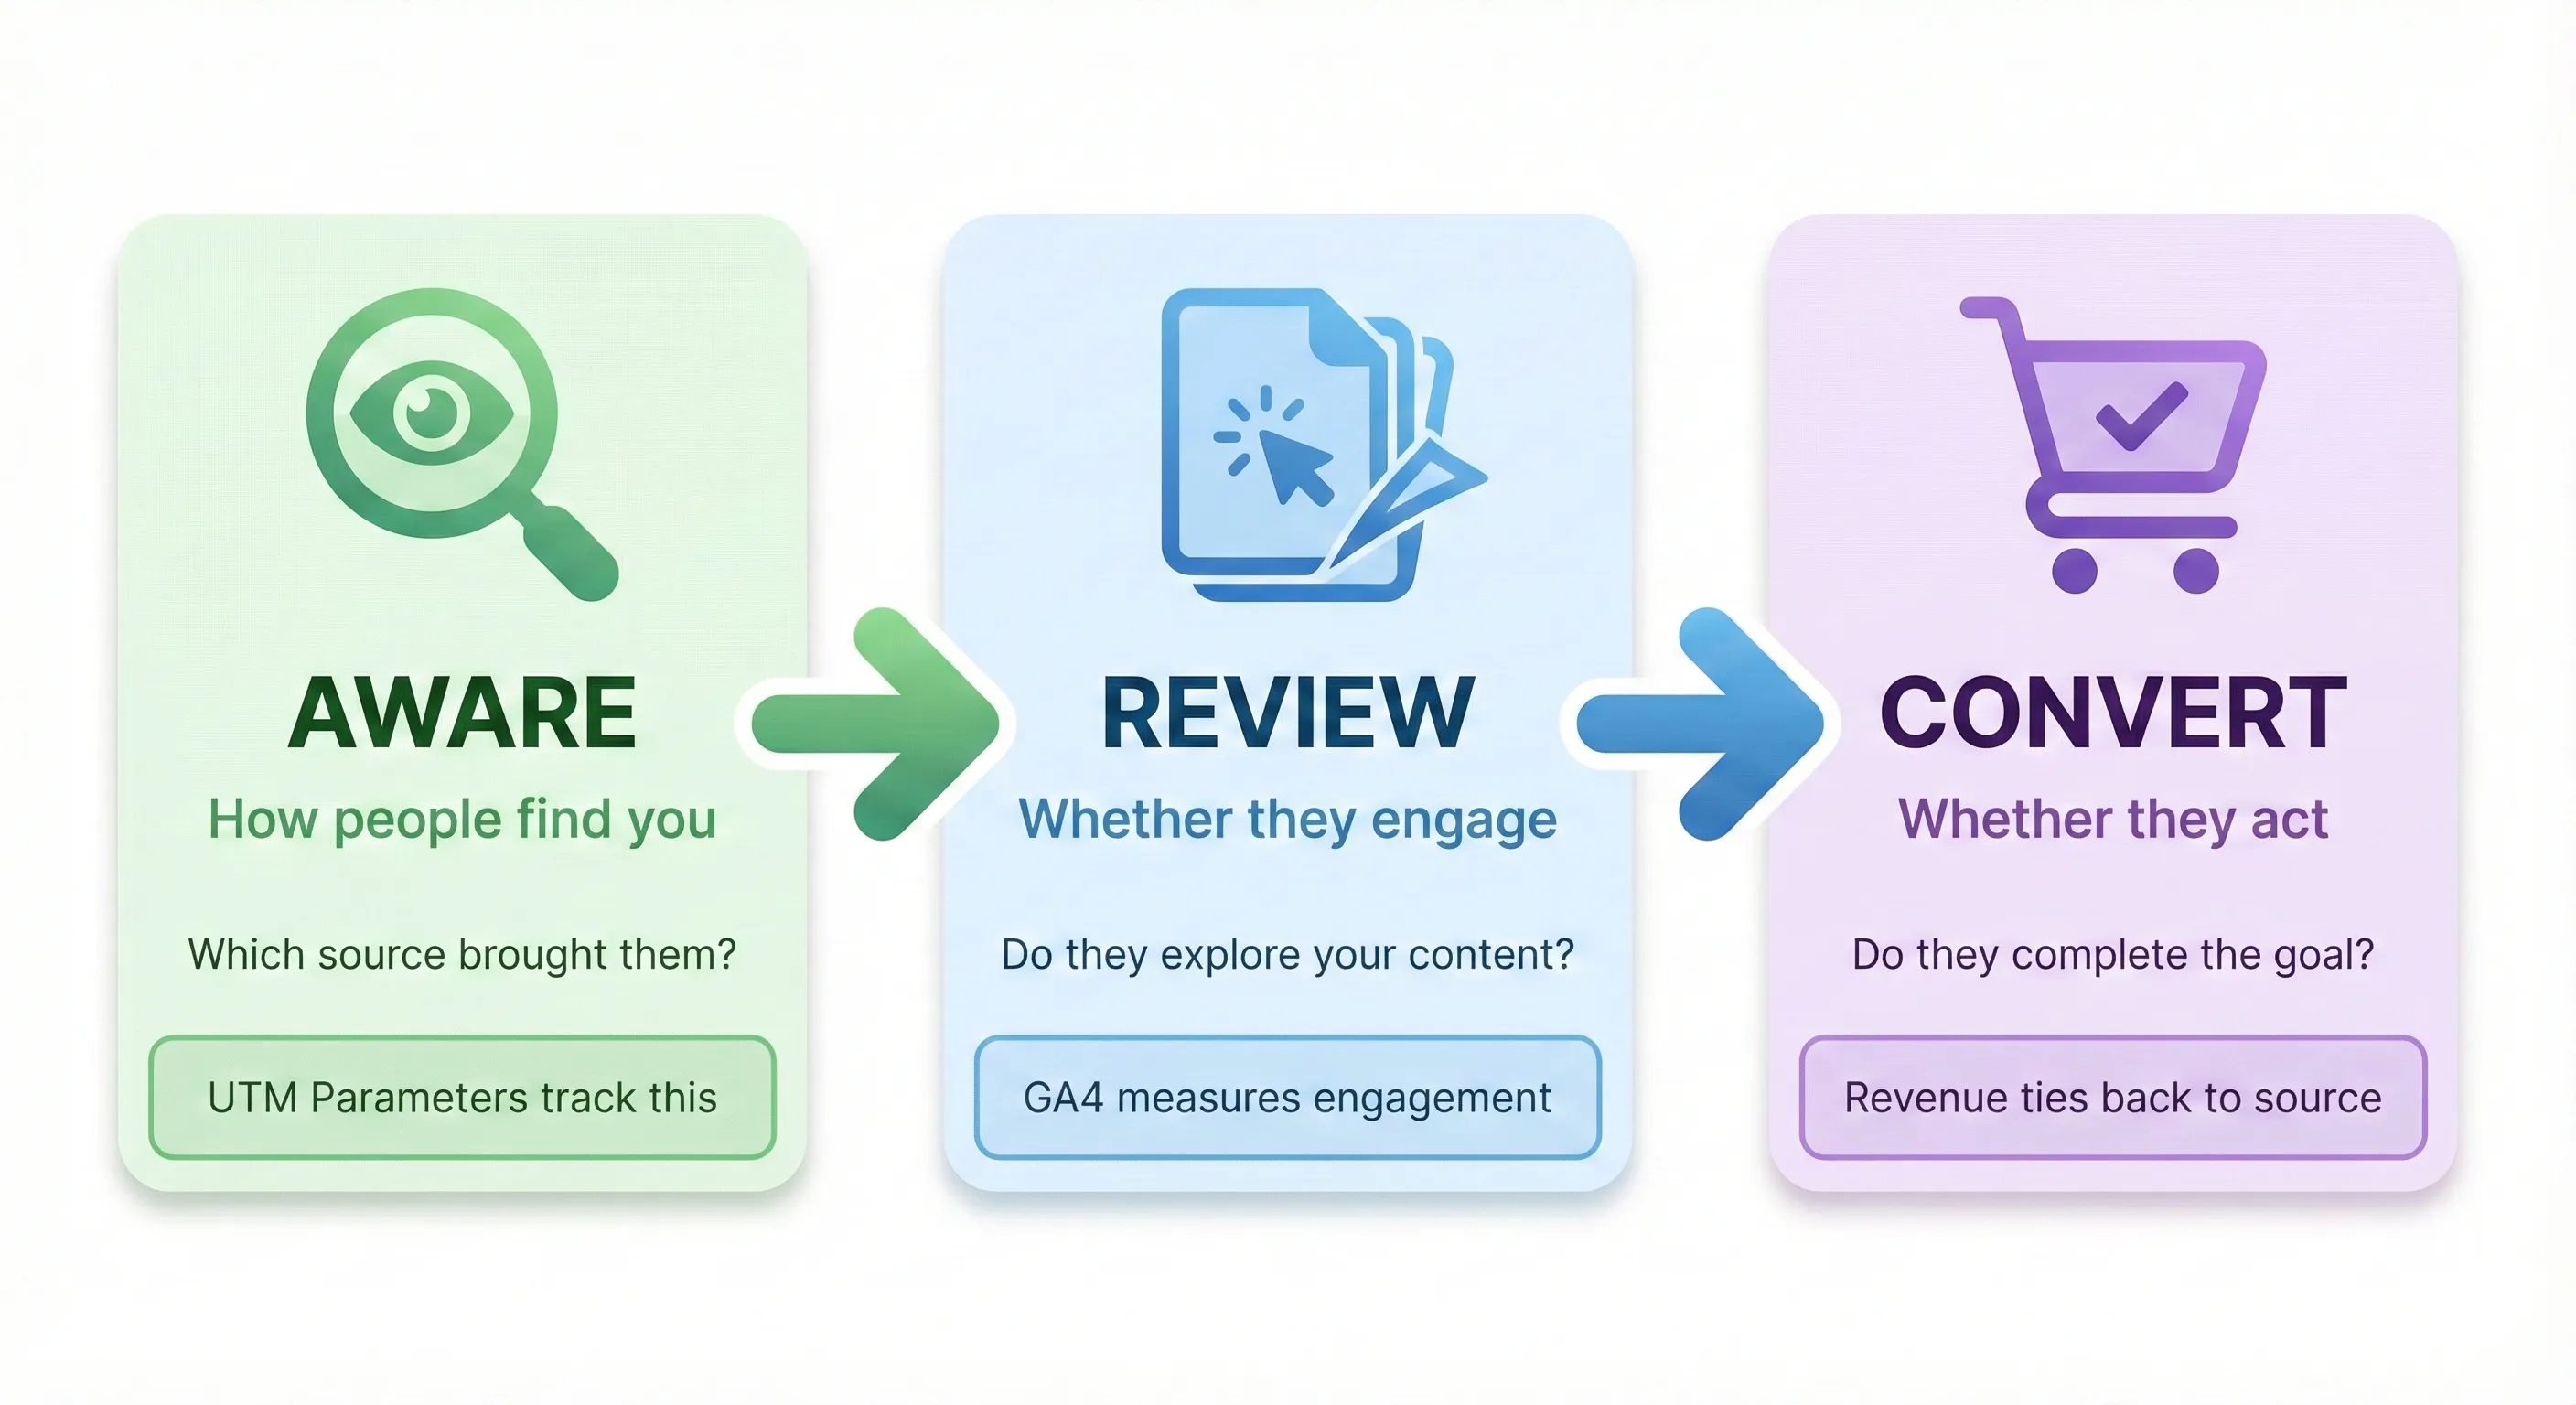
Aware: How potential customers discover your business. This includes finding you through search engines, social media, referrals, or typing your URL directly.
Review: How users evaluate whether you can solve their problem. This includes browsing your pages, reading content, watching videos, comparing options, and checking reviews.
Convert: How users take actions that drive your business outcomes. This includes making purchases, submitting lead forms, signing up for newsletters, or booking consultations.
The questions in this guide map directly to this user journey. We start with foundational traffic questions, which are what to look at first to understand the stages, helping you answer questions about who’s discovering your business and whether that traffic is valuable. We then move to behaviour analysis questions that examine the Review stage in more detail, revealing what users do on your site and where they get stuck. Finally, we address specialised questions for ecommerce businesses and service businesses.
This approach ensures you’re not just collecting data, you’re answering strategic questions that connect directly to business growth. Once you understand this pattern, you’ll know what to measure not just in GA4, but in any analytics tool.
To Get Started You Only Need One Report: The Traffic Acquisition Report
You don’t need to navigate multiple reports to start understanding your traffic. The Traffic Acquisition report reveals insights across your entire user journey – from how traffic discovers you (Aware), to initial indicators of engagement (Review), to which sources drive conversions (Convert). This single report becomes your most efficient starting point and the place you’ll return to most often.
The questions in this section will show you how to extract these insights, giving you a complete picture of your traffic performance from one location in GA4.
Question 1: Where is my traffic coming from?
Behaviour: Aware
Why This Question Matters
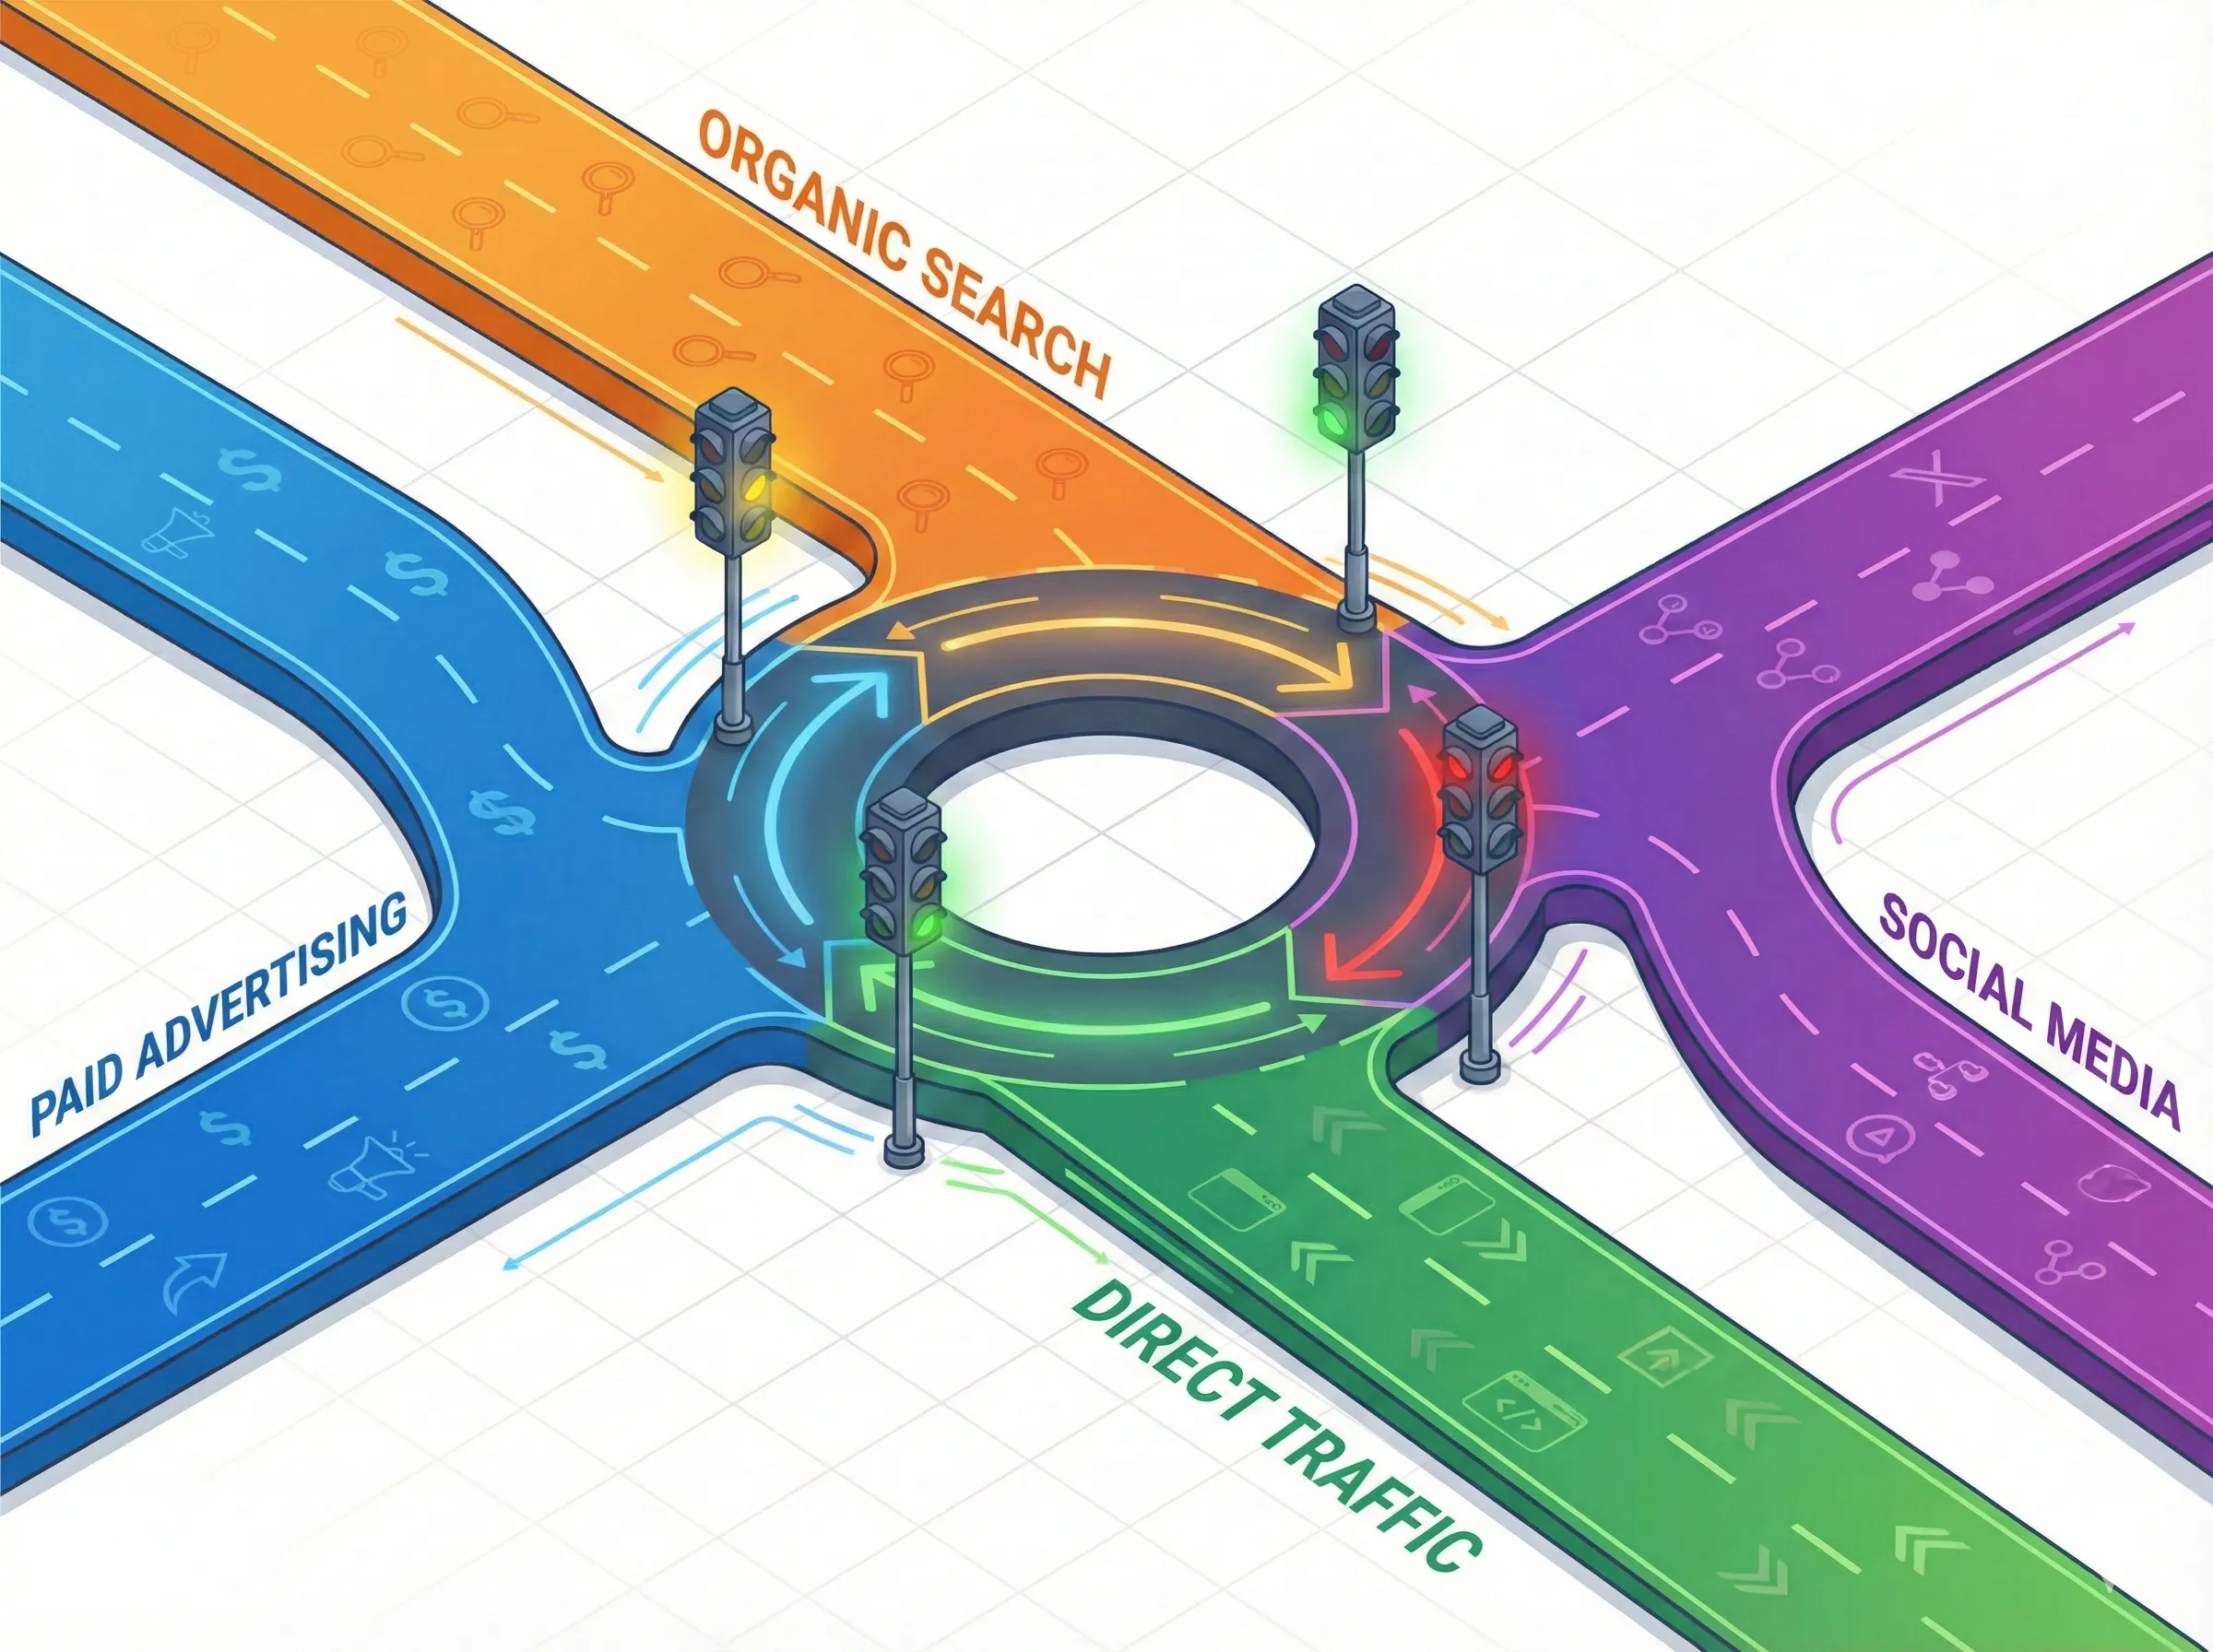
This is the starting point for all marketing analysis. Answering it is essential for understanding your marketing budget’s efficiency and discovering which channels are successfully making potential customers aware of your business. Are your efforts in search engine optimisation (SEO), social media, or paid advertising actually bringing people to your digital doorstep? Without this basic knowledge, you won’t know what lead to your outcomes and you are marketing in the dark.
How to Find the Answer With the Traffic Acquisition Report
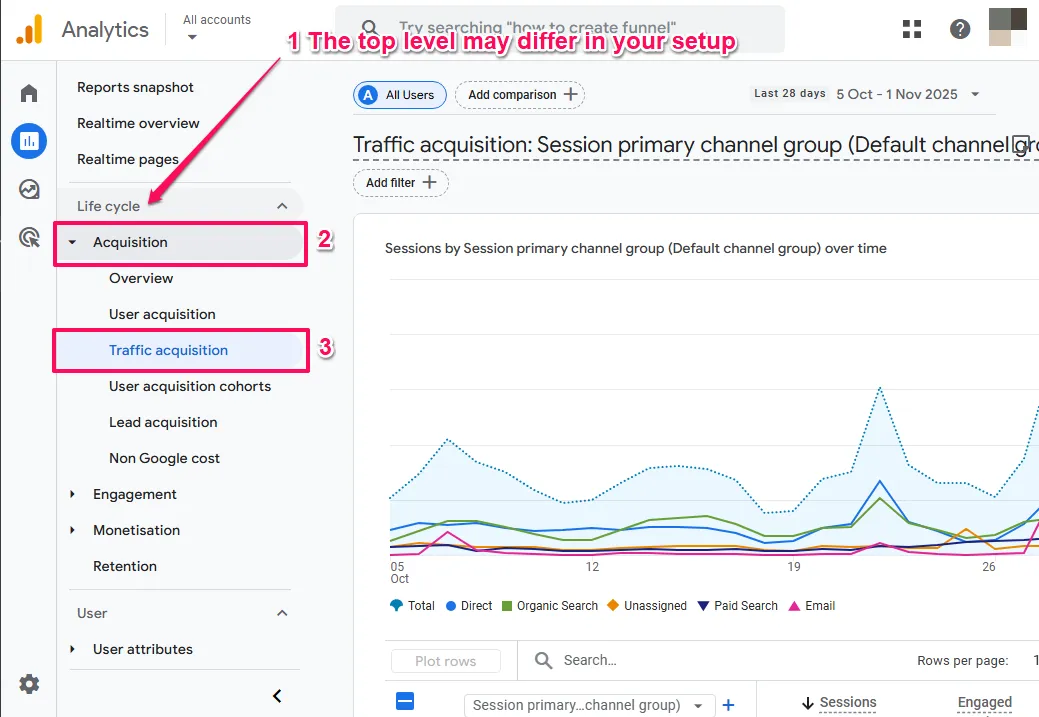
To find to the the Traffic acquisition report:
- In the left menu, navigate to
Reports.
The path to the Traffic acquisition report varies depending on what was selected when GA4 was setup. If your GA4 property was setup before March 27th 2023 or a Business Objective was not selected during initial setup, then the path would be Life cycle > Acquisition > Traffic acquisition.
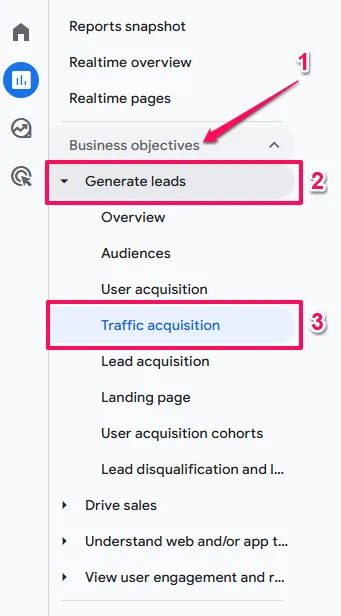
If a Business Objective was selected during GA4 setup, the path would be Business objectives > Generate leads > Traffic acquisition.
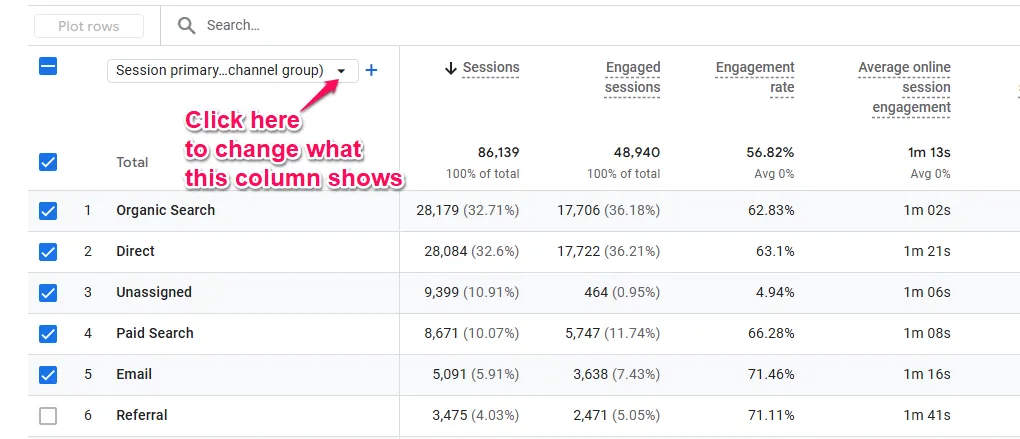
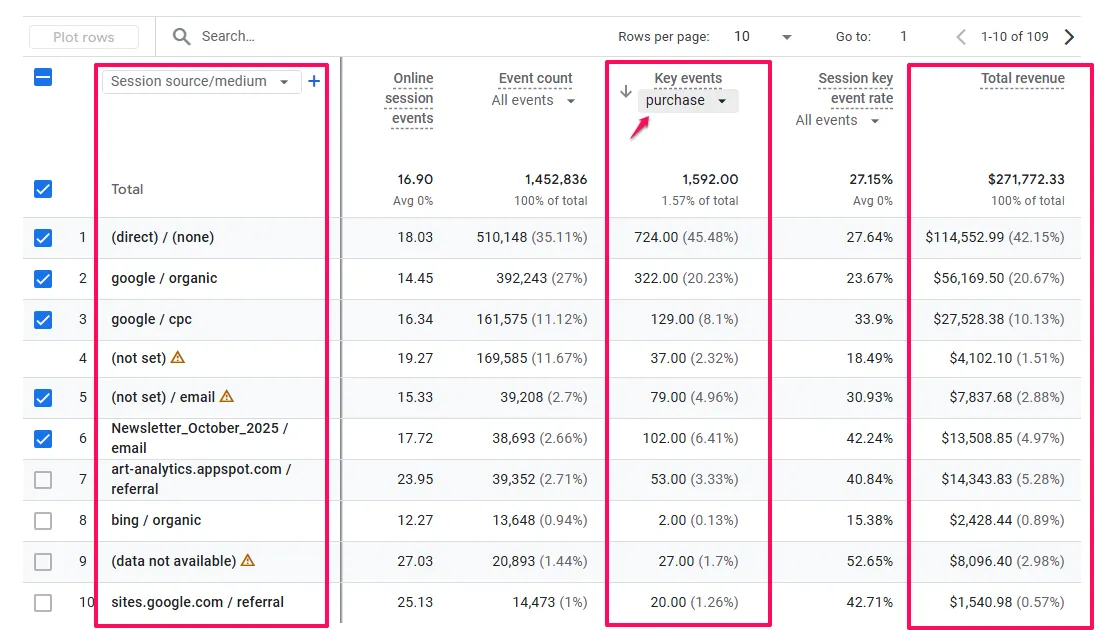
- The report will display a chart and a table. By default, the first column organises the table by
Session default channel group. These are high level grouping based on UTM Parameters. However unrecognised UTMs can be lumped intoUnassignedand the grouping can also mask other issues, so we’ll switch to the underlaying UTMs. Click the dropdown arrow on this column header and selectSession source/mediumas the primary dimension (dimensions organise your data into categories – in this case, by traffic source).
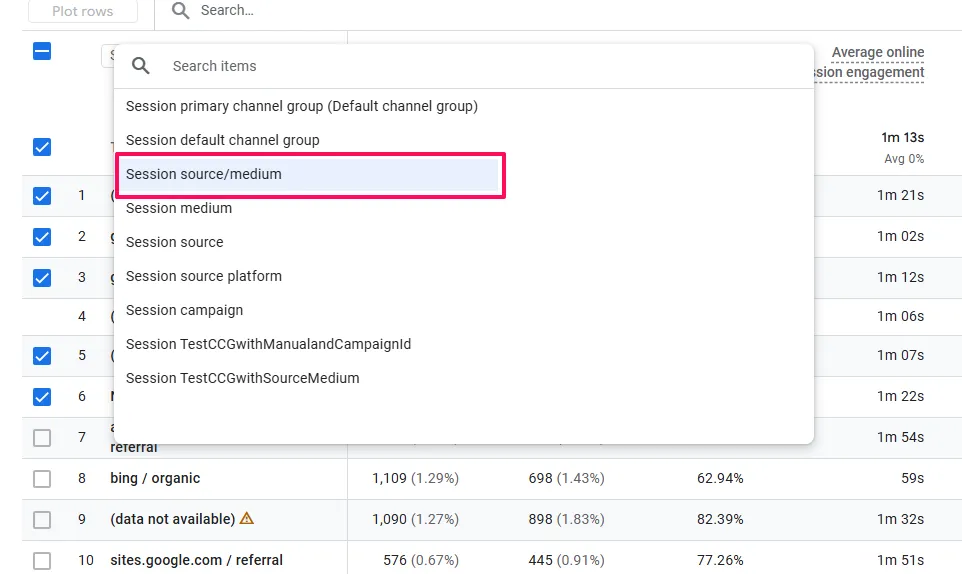
Note: You’ll see “Session” appear throughout this report. A session represents a single visit to your website. If someone visits in the morning and returns in the afternoon, that’s two sessions. This report shows you session-level traffic patterns.
- Your table now shows the specific source and medium combinations for your traffic, such as:
google / organic(visitors from Google search)google / cpc(visitors from Google Ads)facebook / social(visitors from Facebook posts)instagram / social(visitors from Instagram)(direct) / (none)(visitors who typed your URL directly or have unknown sources)
Now look at the columns to the right of Session source/medium. These show metrics (measurements of your traffic performance). The metrics that quantify sessions are:
Engaged sessions: The number of meaningful visits from each source (visits lasting longer than 10 seconds, with a conversion, or including at least two pageviews)Sessions: The total number of all visits, including brief, low-quality visits and bot traffic
Focus primarily on Engaged sessions rather than Sessions. Since Sessions includes bot traffic and accidental clicks that provide no business value, Engaged sessions gives you a much cleaner picture of genuine visitor interest.
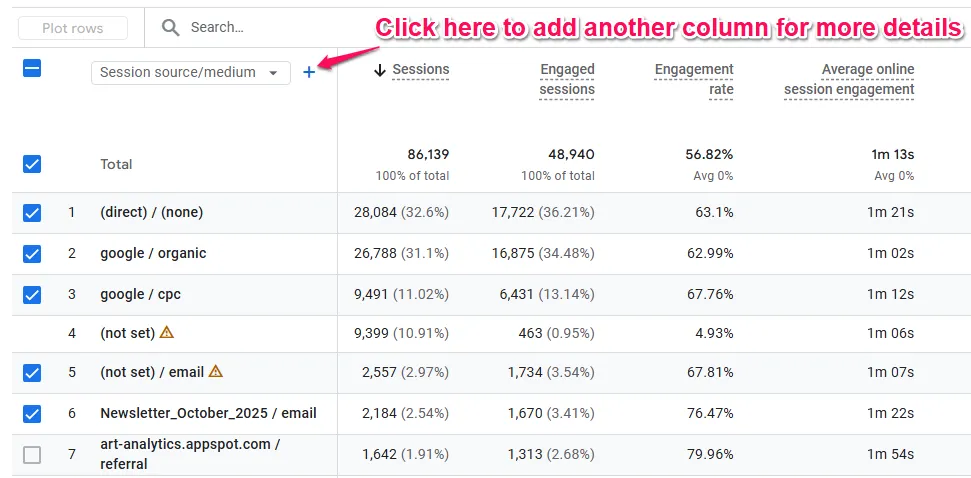
- For a deeper investigation, especially for paid marketing, click the + icon next to the
Session source/mediumcolumn header and addSession campaignas a secondary dimension. This will show you the performance of specific campaigns you are running.
What to Do Next (The Action)
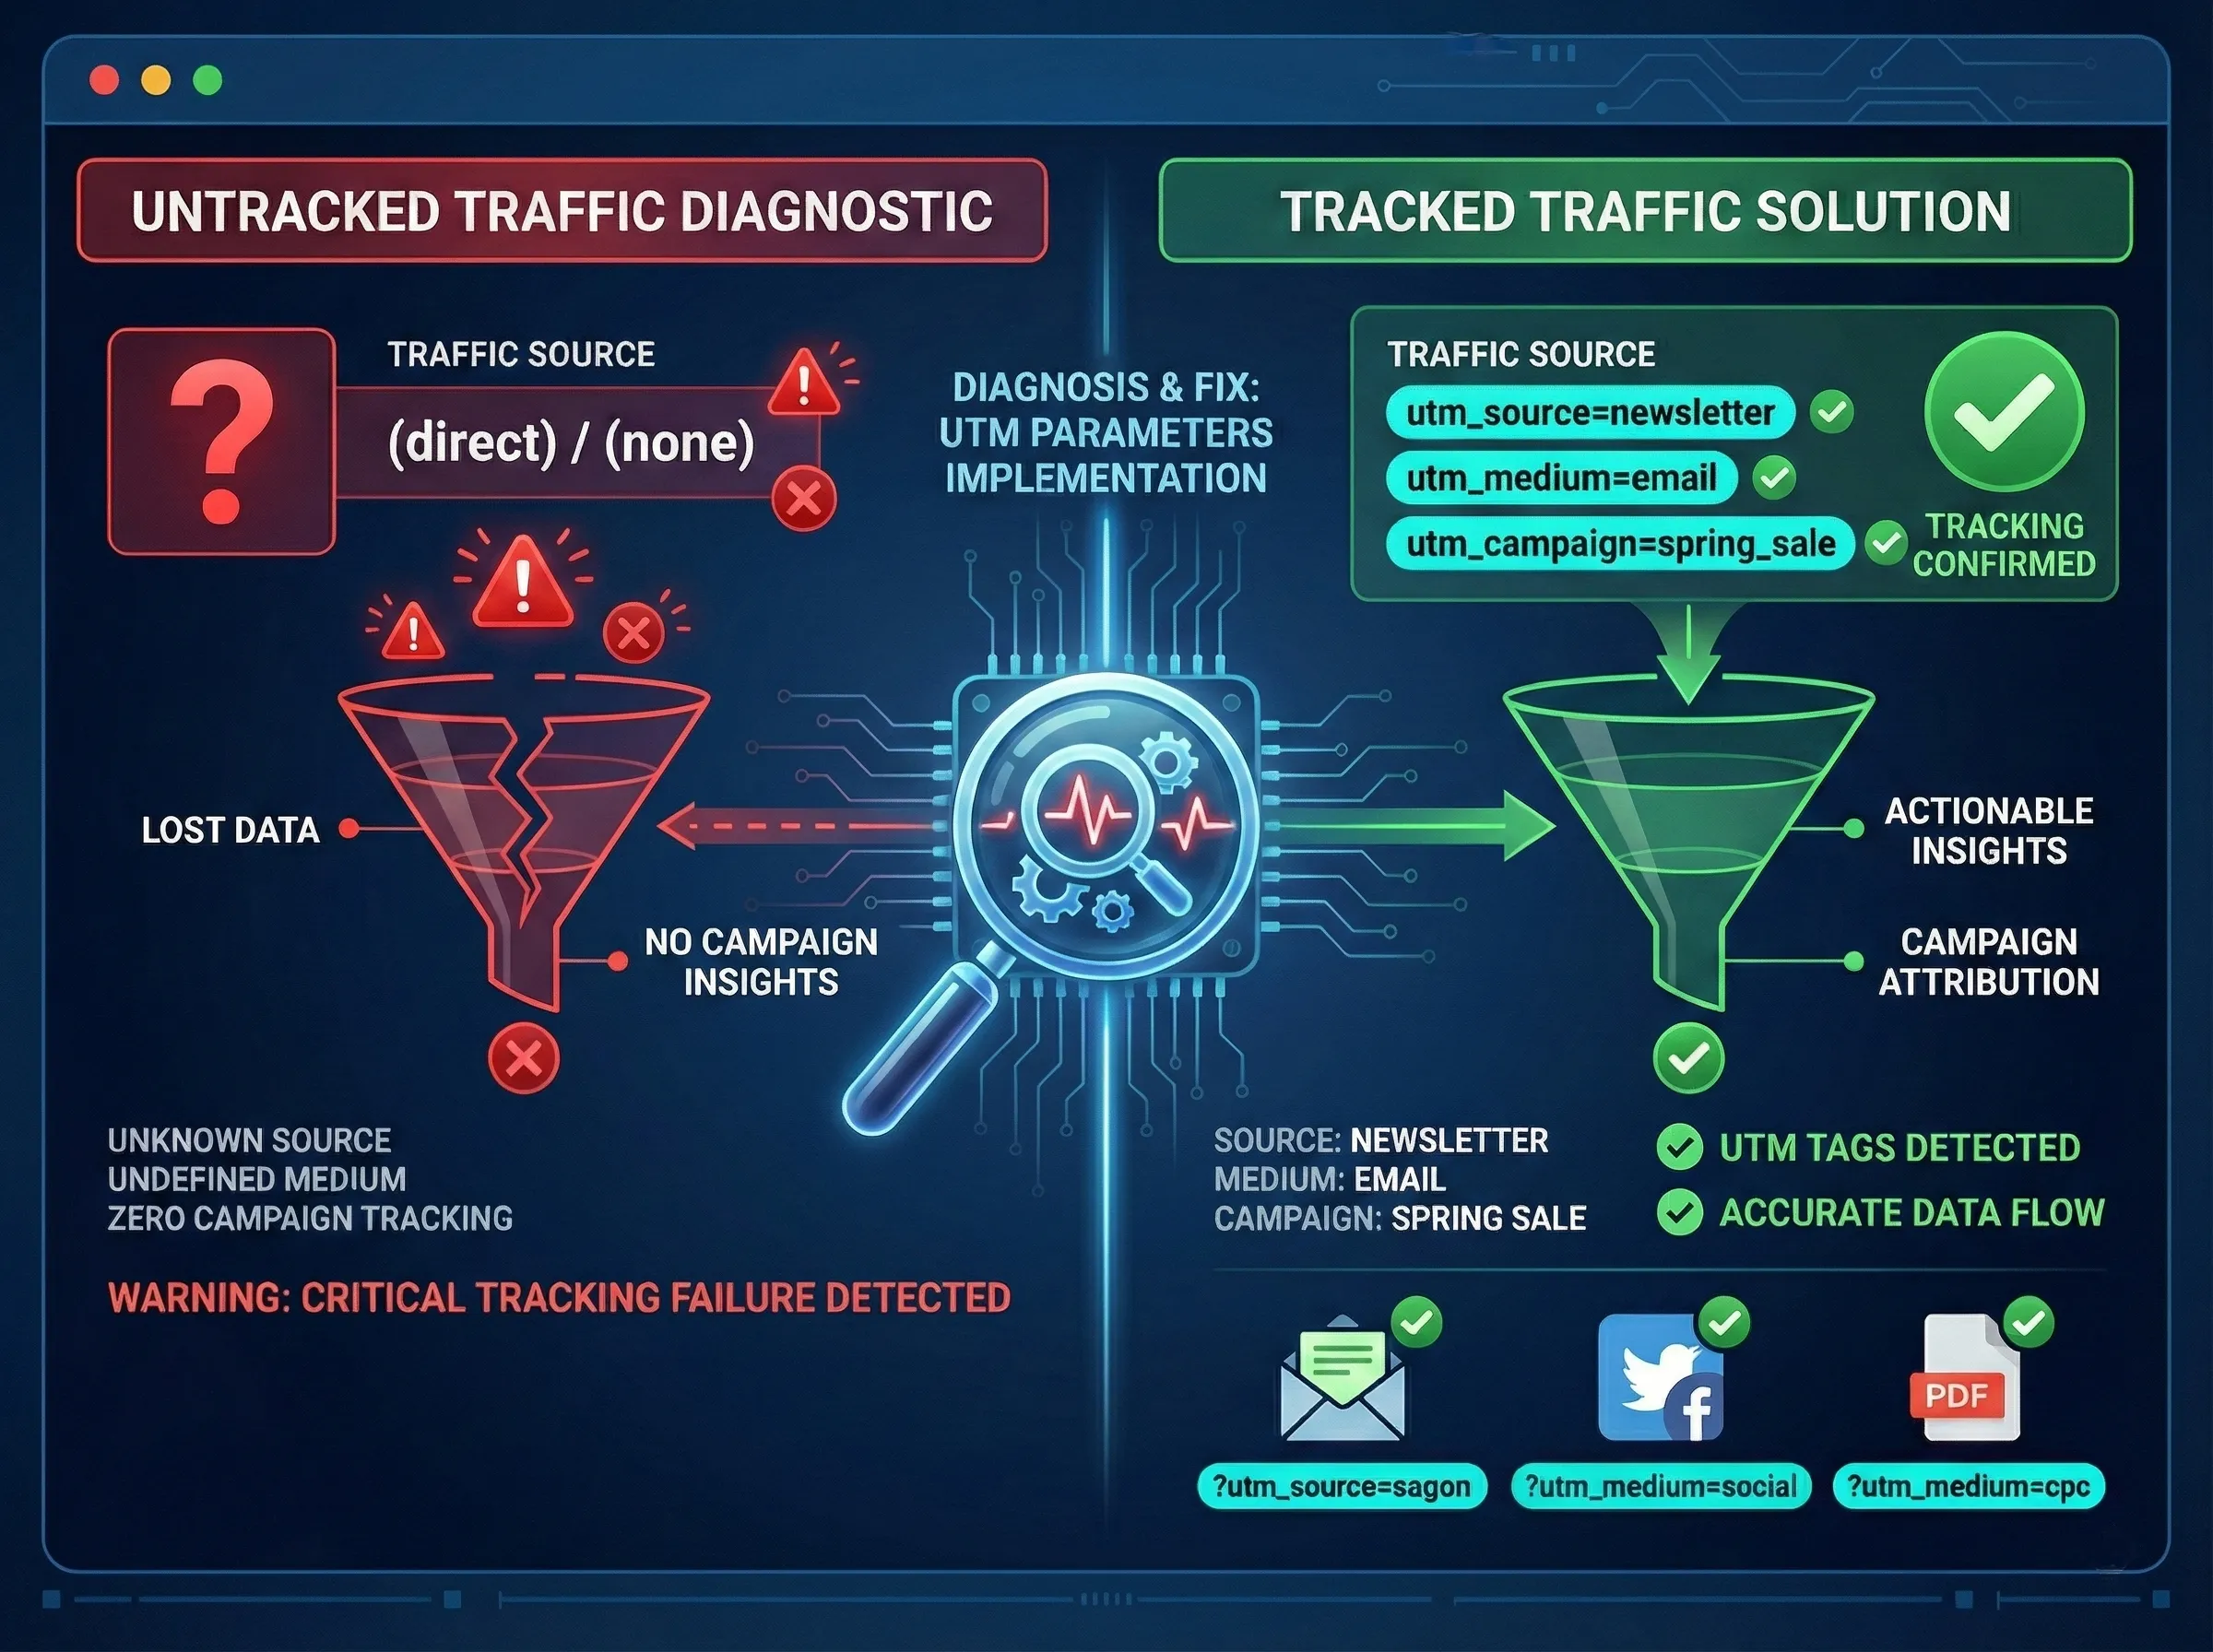
If you see a lot of traffic under (direct) / (none)
Then Diagnose whether this is a tracking gap:
- Whilst some direct traffic is legitimate (users typing your URL directly or clicking from bookmarks), a high percentage often means GA4 cannot identify the true source because of missing tracking information.
- Check if you are running email campaigns, social media ads, or linking from PDF documents without UTM tracking links.
- Without proper tracking, GA4 is blind to many of your marketing efforts, and you cannot properly measure your return on investment (ROI).
And Optimise by implementing UTM parameters:
- Add UTM parameters to all your marketing links to ensure accurate attribution.
- Use a UTM builder tool to create consistent, properly formatted tracking links.
- Implement a naming convention for campaigns to keep your data organised.
- Educate your team about the importance of using tracked links for all external marketing.
If you see high traffic from google / organic (or other search engines)
Then Diagnose which specific pages are ranking well:
- Add a secondary dimension of
Landing page + query stringto see which pages are attracting search traffic. - Cross-reference with Google Search Console to identify which search queries are driving this traffic.
- Understand which topics and content types are successfully attracting organic visitors.
And Optimise by creating more content around successful topics:
- Build on your momentum by creating additional content that targets related keywords.
- Update and expand your top-performing pages to strengthen their rankings.
- Develop content clusters around your successful topics to establish topical authority.
- Use internal linking to connect related content and boost the visibility of newer pages.
If you see a source/medium combination you are investing in (like google / cpc for Google Ads or a specific email campaign) has low traffic
Then Diagnose if your campaign is actually running:
- Check if the campaign is active and not paused or limited by budget.
- Verify that your ads are being approved and shown (not rejected for policy violations).
- Confirm that your UTM tracking is implemented correctly so traffic is being attributed properly.
- Compare the traffic volume to your expected reach based on budget and targeting settings.
And Optimise your visibility approach:
- If the campaign is paused or budget-limited, restore it to see expected traffic levels.
- If ads are rejected, fix policy violations and resubmit for approval.
- If traffic is lower than expected despite campaign running properly, note this for later investigation in Question 2 (which sources convert) and Question 4 (which sources engage) before making budget decisions.
- If tracking is broken, implement proper UTM parameters so you can accurately measure this source’s performance.
Question 2: Which traffic sources are leading to conversions?
Behaviour: Aware → Convert

Why This Question Matters
Traffic by itself is a vanity metric. What truly matters is traffic that contributes to your business goals. This question connects your marketing channels directly to profitable growth and ROI, moving from simple awareness to the all-important conversion. Answering this tells you not just who is showing up, but what’s actually working to grow your business.
How to Find the Answer With the Traffic Acquisition Report
You will use the same report as before but focus on a different part of the table.
- Stay in the
Reports>Acquisition>Traffic acquisition report. - Scroll the table horizontally to the right until you find the Key events column. In GA4, important actions you want to track, which were called “Goals” in Universal Analytics, are now called “Key Events”.
Note: If you’re familiar with GA4’s evolution, you may have heard these called “Conversions” in earlier versions of GA4. Google renamed them to “Key Events” in 2024, but they function identically. Some documentation may still reference the old “Conversions” terminology.
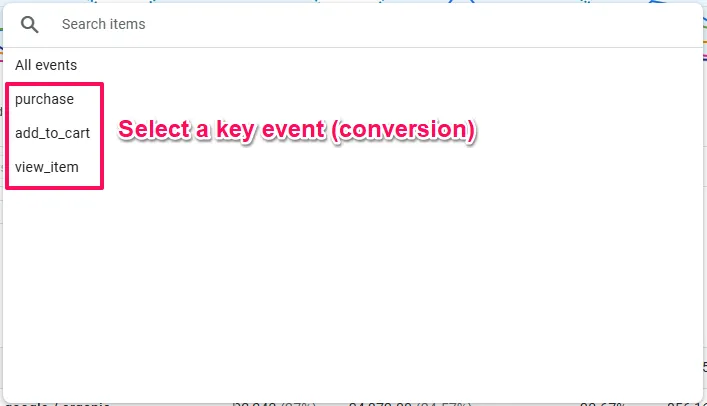
- This column shows the total number of key events attributed to each channel. To see data for one specific outcome, click the small dropdown arrow next to the
Key eventscolumn header and select the specific event you care about, such aspurchasefor an ecommerce store orgenerate_leadfor a service business. You can also look at the Total revenue column (for ecommerce) to measure success by revenue generated.
What to Do Next (The Action)

If your Key events column shows all zeros
Then Diagnose your setup:
- If you know you’re getting sales or leads but this column is empty, you’ve found the most common and costly setup gap in GA4.
- This means the events are not being tracked and/or you haven’t told GA4 what a “key event” is for your business.
- You must first have an event being tracked (like a purchase event) and then explicitly mark it as a key event.
- The purchase event is a key event by default so if you are an ecommerce business it means conversion tracking for purchases has not been implemented.
And Optimise by configuring key events:
- Ensure tracking has been implemented for your key events (depending on your platform it could be built in, require a plugin or need specialised setup eg using Google Tag Manager).
- Navigate to
Admin(gear icon in bottom-left) >Data display>Events. - Find the events that represent your important business outcomes (like generate_lead, or form_submit).
- Click the star icon next to your most important events to mark them as key events.
- Wait 24 hours for data to populate before checking the report again.
If you see a source/medium combination with a high number of key events (conversions)
Then Diagnose the specific campaigns driving this success:
- Add
Session campaignas a secondary dimension to identify which campaigns are performing best. - Review what makes these campaigns successful (targeting, messaging, creative, offer).
- Check if certain landing pages associated with this source convert particularly well.
- Understand the audience characteristics that respond to this source.
And Optimise by reallocating marketing budget and effort:
- Significantly increase investment in this winning source and campaign combination.
- Scale successful campaigns before they reach saturation.
- Apply the successful elements (messaging, targeting, creative approach) to other campaigns and sources.
- Ensure your conversion process can handle increased volume without degrading user experience.
If you see a source/medium with high traffic but very few key events
Then Diagnose the potential mismatch:
- Check if the promise in your ad or social post aligns with the experience on the landing page.
- Add
Session campaignas a secondary dimension to see if specific campaigns are underperforming. - Review the landing page content, design, and call-to-action clarity.
- Note this source to investigate further in Question 4 (engagement time) to see if visitors are even interested enough to explore.
And Optimise the visitor experience and targeting:
- Rewrite landing page headlines and introductions to better match visitor intent and the marketing message that brought them.
- Ensure your call-to-action is prominent, clear, and compelling.
- A/B test different landing page variations to improve conversion rates.
- If engagement data from Question 4 shows low interest, then revisit your audience targeting; if engagement is high but conversion is low, focus on the conversion path itself.
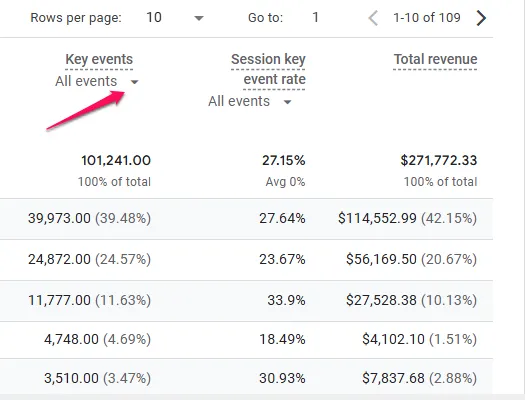
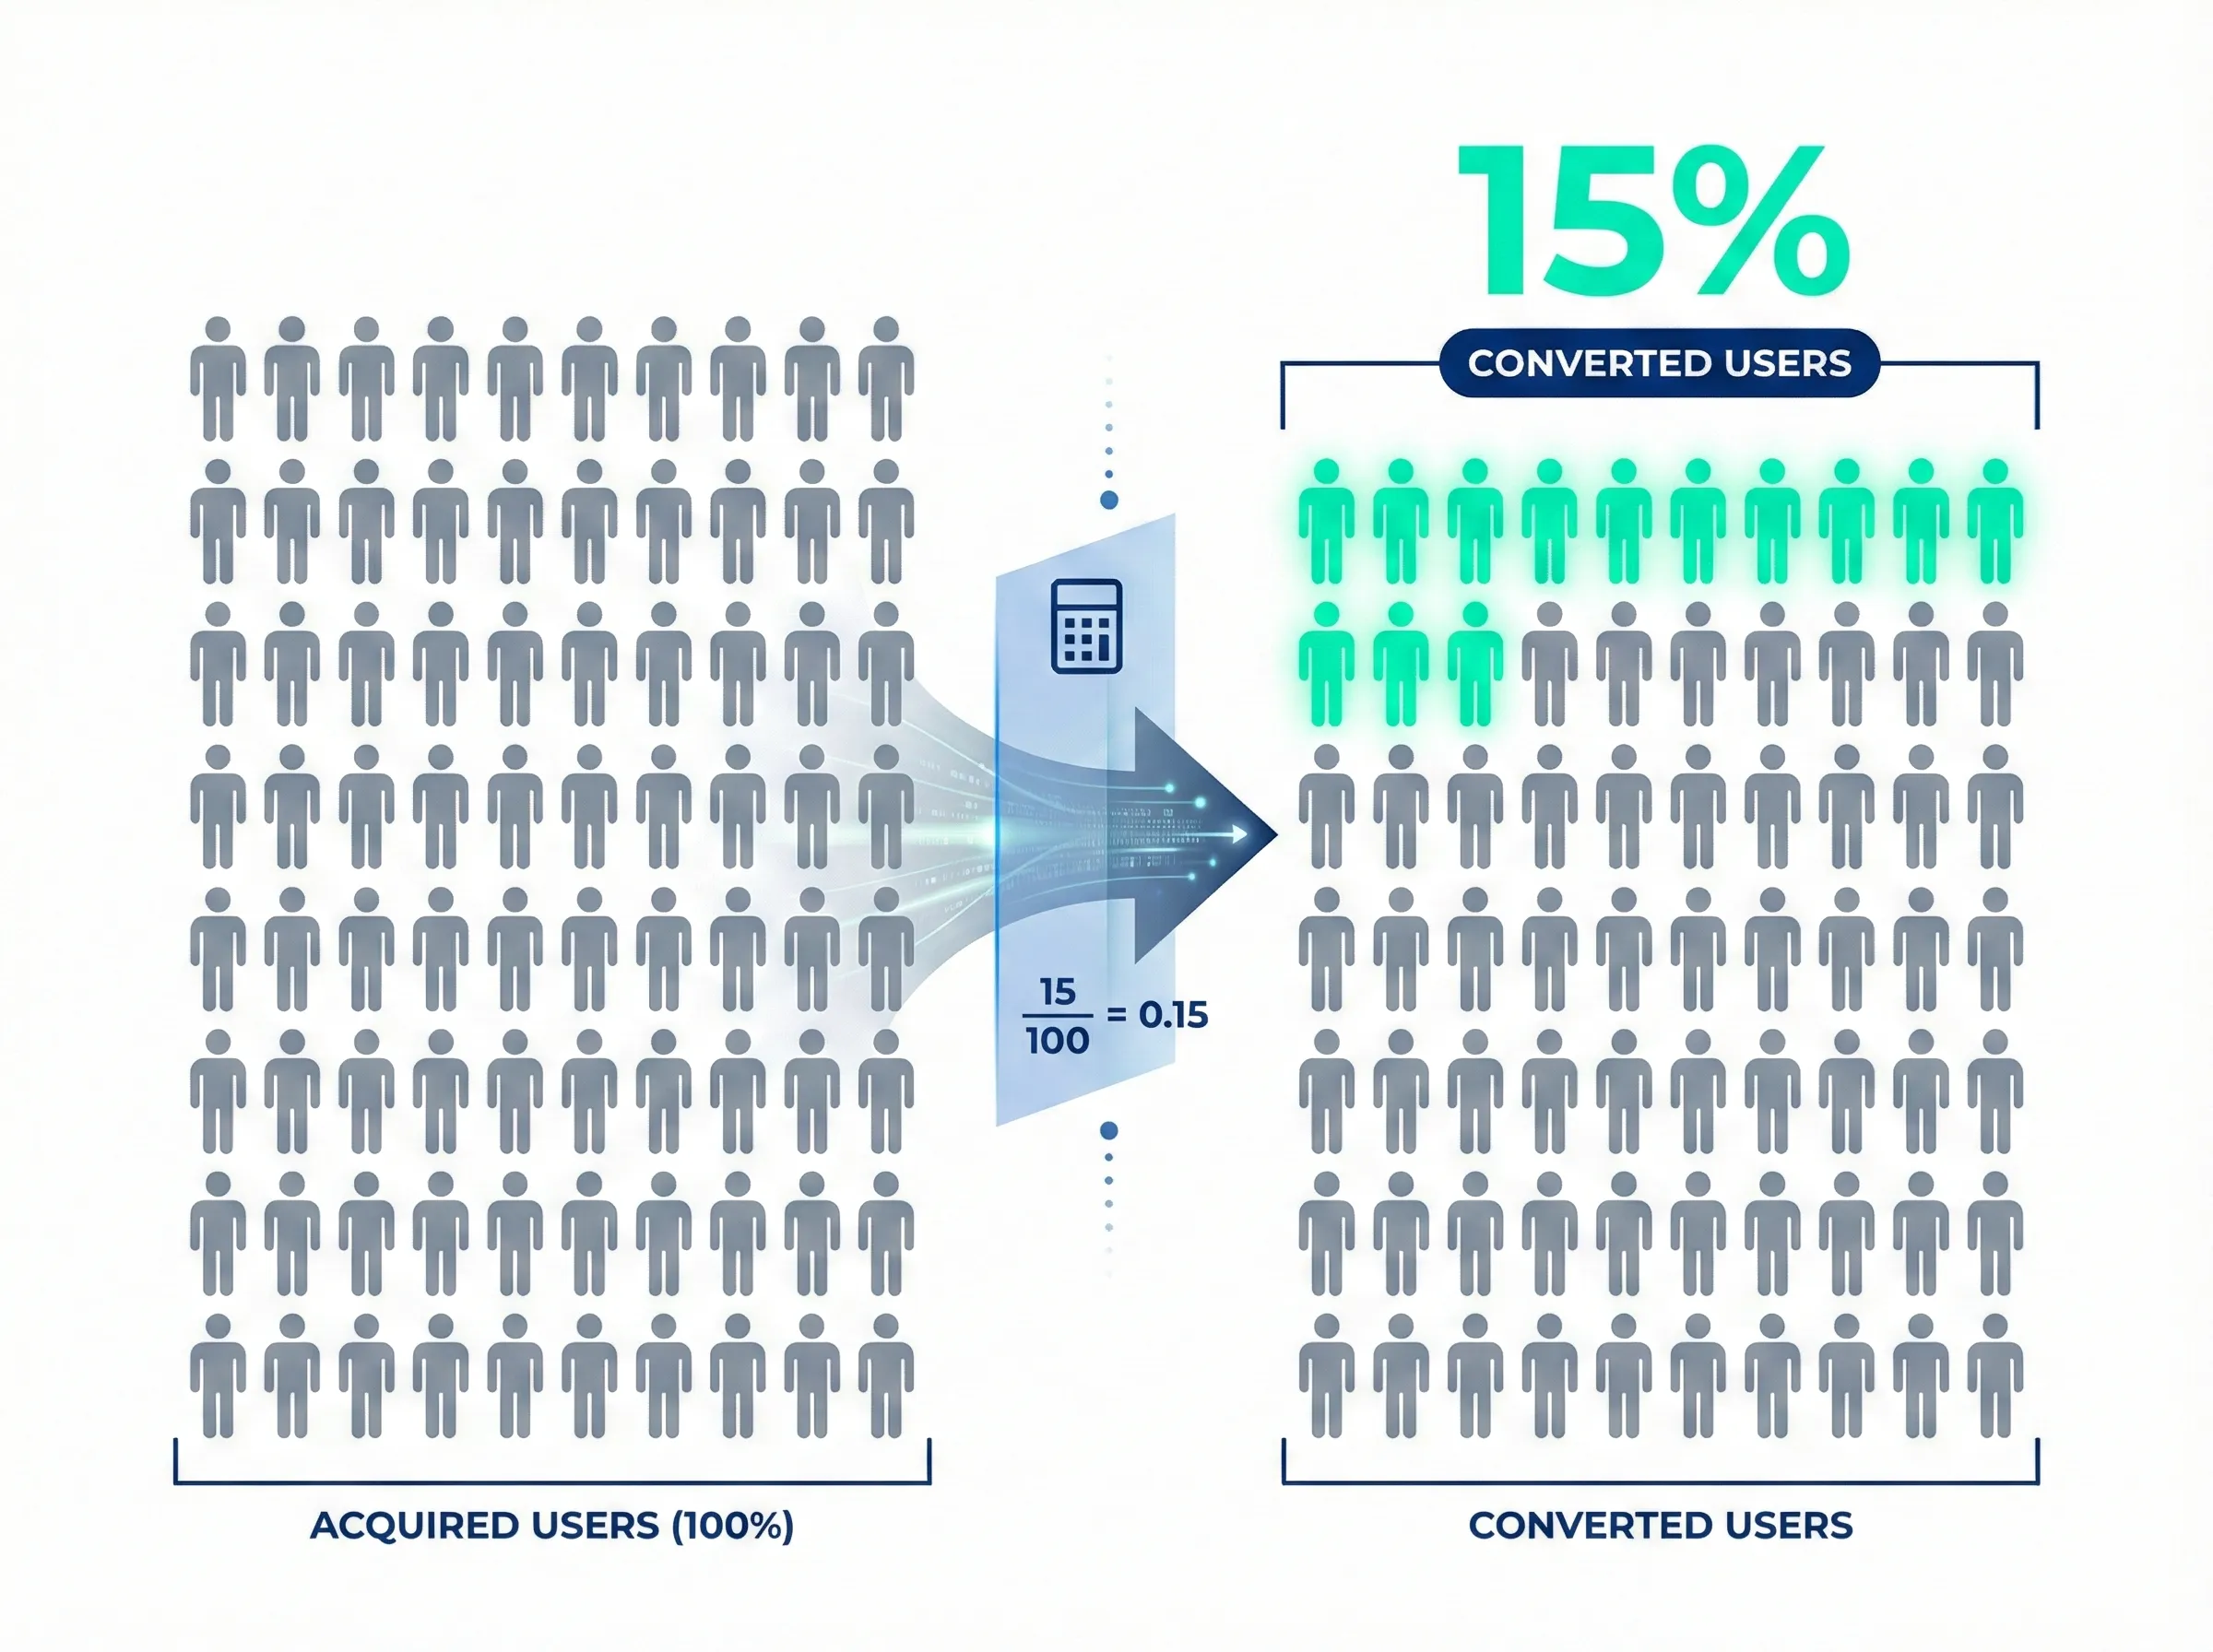
Question 3: What percentage of my traffic converts?
Behaviour: (overall) Convert | (broken down by acquisition source) Aware → Convert
Why This Question Matters
This metric is your website’s overall report card. It measures your site’s effectiveness at turning visitors into customers or leads. When you break it down by Session source/medium and Session campaign, you can see which marketing efforts are most effective at driving conversions. A low conversion rate indicates friction in your user experience, while a high one shows you’re doing a great job. Improving this single number can have a massive impact on your bottom line without spending any additional money on advertising.
How to Find the Answer With the Traffic Acquisition Report
You can find conversion rates directly in the Traffic acquisition report.
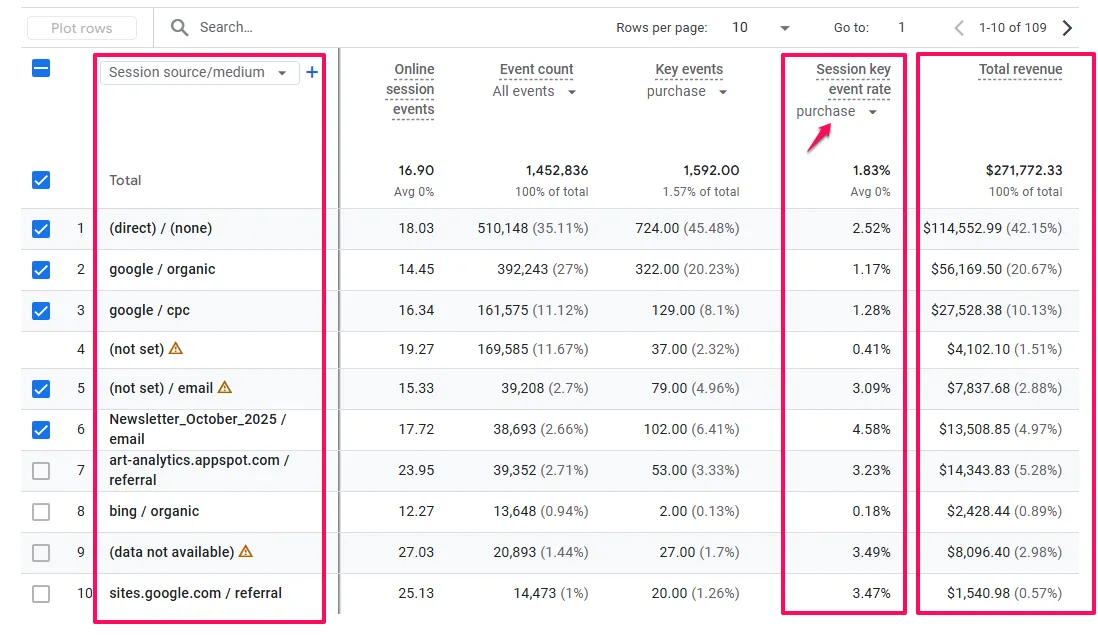
- Navigate back to
Reports>Acquisition>Traffic acquisitionand look for these columns: Session key event rate: This tells you the percentage of sessions that resulted in a key event (conversion). By default, it shows the rate for all key events combined, but you can click the dropdown arrow next to the column header to view the rate for a specific conversion likepurchaseorgenerate_lead. This metric is great for measuring the effectiveness of each traffic source at driving conversions.
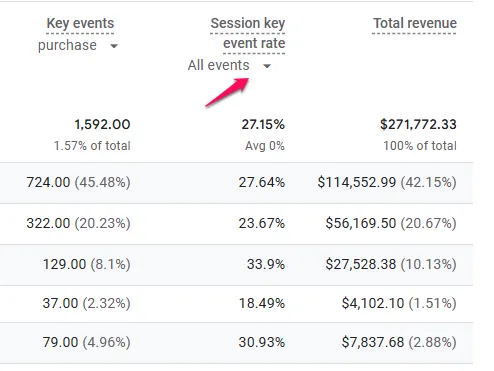
- Key events: This column shows the total number of conversion events by traffic source. Like the rate column, you can use the dropdown to filter to a specific key event.
- Total revenue (for ecommerce): This column shows the revenue generated by each traffic source, giving you another powerful way to measure which channels are leading to valuable conversions.
Note: Key events is GA4’s current term for what were previously called Conversions.
What to Do Next (The Action)

If conversion rates vary dramatically across different source/medium combinations
Then Diagnose the quality and alignment differences:
- Sort the Traffic acquisition report by Session key event rate (click the column header) to identify your best and worst converting sources.
- Add Session campaign as a secondary dimension (click the + icon next to Session source/medium) to see if specific campaigns explain the variance.
- Compare landing pages used by high-converting vs. low-converting sources by adding Landing page as a secondary dimension.
- Note the difference between your highest and lowest converting sources (e.g., if one source converts at 5% and another at 0.5%, that’s a 10x difference worth investigating).
And Optimise by learning from high performers and fixing low performers:
- For sources with conversion rates 3x or higher than your lowest performers, analyse what makes them different (audience quality, messaging alignment, landing page relevance).
- Apply successful elements from high-converting sources to improve low performers (match messaging style, replicate landing page structure, refine targeting).
- Consider pausing or significantly revising campaigns from sources with conversion rates below 30% of your best-performing source.
- Adjust landing pages for low-converting sources to better match the visitor’s intent and the marketing message that brought them.
- Reallocate budget from low-converting sources to high-converting ones to improve overall marketing ROI.
If a high-traffic source has a notably low conversion rate
Then Diagnose the potential mismatch:
- Identify sources that appear in the top 5 for Sessions or Engaged sessions but appear much lower when you sort by Session key event rate.
- Check if the promise in your ad or social post aligns with the experience on the landing page by adding Landing page as a secondary dimension.
- Review whether the source’s Session campaign names (add as secondary dimension) reveal any specific campaigns that are underperforming.
- Cross-reference with Question 4 data (Average engagement time per session) to see if visitors from this source are even interested enough to explore.
And Optimise the visitor experience and targeting:
- Rewrite landing page headlines and introductions to better match visitor intent and the marketing message that brought them.
- Ensure your call-to-action is prominent, clear and compelling (use action-oriented language like ‘Get Your Free Quote’ instead of generic ‘Submit’).
- A/B test different landing page variations to improve conversion rates for this specific traffic source.
- If engagement data from Question 4 shows low interest, revisit your audience targeting in the source platform (the people you’re reaching may not be a good fit). If engagement is high but conversion is low, focus on improving the conversion path itself (forms, calls-to-action, trust signals).
- Consider whether this source’s role might be brand awareness rather than direct conversion, and adjust your expectations and strategy accordingly.
Question 4: Which traffic sources bring visitors who take time to explore what I offer?
Behaviour: Aware → Review
Why This Question Matters
Now that you know which sources drive conversions (Questions 2 and 3), this question explains why some perform better than others. It reveals traffic quality by measuring how much time visitors spend exploring your content, products, or services.
For established businesses, this is a diagnostic tool. A source might convert well, but if visitors spend little time engaging, those may be lower-value customers or unsustainable conversions. High exploration time indicates genuinely interested prospects who thoroughly evaluate your offering.
For new businesses without conversion data yet, this becomes your first indicator of valuable traffic. Average engagement time shows which marketing efforts attract genuinely interested people, helping you allocate budget before sales or leads accumulate.
Understanding which sources bring engaged explorers helps you invest in channels that attract serious prospects, rather than chasing traffic volume or relying solely on conversion data.
How to Find the Answer With the Traffic Acquisition Report
You’ll use the same Traffic acquisition report from Question 1, but this time you’ll focus on a different metric.
- Navigate to
Reports>Acquisition>Traffic acquisition(or the path appropriate for your GA4 setup as described in Question 1). - In the data table, you’ll see
Session source/mediumas your primary dimension (if you changed it in Question 1, it should still be set this way). - Scroll horizontally to the right in the table until you find the
Average engagement time per sessioncolumn. This metric shows the average amount of time visitors from each source spent actively engaged with your site. - Click on the
Average engagement time per sessioncolumn header to sort by highest time first. This instantly reveals which traffic sources bring visitors who spend the most time exploring your content.
Note on data quality: As mentioned in Question 1, focusing on engaged sessions rather than all sessions gives you cleaner data by filtering out bot traffic and accidental clicks. The Average engagement time per session metric naturally focuses on meaningful interactions, giving you a more accurate picture of genuine visitor interest.
What to Do Next (The Action)
If you see a traffic source has high traffic volume but very low Average engagement time per session
Then Diagnose technical measurement issues first:
- If you see many sessions with exactly 0s engagement time (particularly from users in the EU or regions with strict privacy laws), this may be caused by Consent Mode restrictions. When users decline analytics cookies, the user_engagement events may not fire correctly. Check your consent implementation before assuming content issues.
Then Diagnose the disconnect between expectation and experience:
- Review the ad copy, social media post, or link description that’s driving traffic from this source. What are you promising?
- Check the landing page these visitors arrive on. Does it immediately deliver what was promised?
- Look at whether the audience targeting for this source is too broad, attracting curious clickers rather than serious prospects.
And Optimise by aligning promise with experience:
- Rewrite ad copy to be more specific about what visitors will find, filtering out unqualified clicks.
- Adjust audience targeting to focus on people who match your ideal customer profile.
- Improve the landing page to better match the messaging that brought visitors there, ensuring the headline and first paragraph immediately address their intent.
If you see a traffic source shows high Average engagement time per session but low conversion rates
Then Diagnose the barrier to conversion:
- These visitors are clearly interested (they’re spending time exploring), but something is preventing them from taking the next step.
- Check if there’s a clear, compelling call-to-action on the pages these visitors view most (add Landing page as a secondary dimension to see their entry points).
- Consider whether your pricing is clearly displayed and competitive.
- Note this source for funnel analysis in Question 9 to see exactly where engaged visitors drop off.
And Optimise by removing friction:
- Add or improve calls-to-action on the most-viewed pages from this source.
- Consider offering a lower-commitment next step (like “Request a quote” instead of “Buy now,” or “Download our guide” before asking for a consultation).
- Add trust signals like testimonials, security badges, or guarantees near conversion points.
- Once you’ve completed Question 9’s funnel analysis, you’ll know exactly which step needs optimization for this engaged traffic.
Understanding Traffic from a User Perspective
The Traffic Acquisition report you’ve been using tracks sessions (visits). The User Acquisition report tracks users (people). Here’s the practical difference:
Session perspective asks: “Which source brought today’s traffic?” and “Which source gets credit for this converting visit?” User perspective asks: “Which source originally brought this person to us?” and “Which source acquired this converting customer?”
If someone discovers you through Instagram on Monday, returns via Google search on Wednesday, and converts on Friday by typing your URL directly, the session view shows three separate visits and typically credits the conversion to Google (the last non-direct source). The user view credits Instagram – the source that acquired this customer in the first place.
Both perspectives are valuable for different decisions:
- Check session data regularly: For day-to-day marketing performance and immediate campaign results
- Review user data periodically: For understanding which channels are most effective at customer acquisition and measuring your true cost to acquire a customer
The following questions mirror the previous section but use the User Acquisition report to answer these acquisition-focused questions.
Question 5: Which sources are most effective at bringing new people to my business?
Behaviour: Aware
Why This Question Matters
Whilst session data shows you where today’s traffic comes from, user data reveals which channels are best at acquiring new people. This is critical for understanding your top-of-funnel performance and allocating brand awareness budget effectively.
A channel might generate many sessions but few new users (indicating it’s good at bringing back existing visitors rather than acquiring new ones). Conversely, a channel with fewer sessions but many new users is excellent at expanding your audience. Understanding this distinction helps you invest in the right channels for growth versus the right channels for re-engagement.
This question helps you identify your most effective customer acquisition channels, measure the true reach of your marketing efforts, and understand which sources are bringing fresh audiences to your business.
How to Find the Answer With the User Acquisition Report
You’ll use the User Acquisition report, which tracks first-touch attribution.
- In the left menu, navigate to Reports > Acquisition > User acquisition.
- The report displays by default with First user default channel group as the primary dimension. Click the dropdown arrow on this column header and select First user source/medium (dimensions organize your data into categories – in this case, by the source that originally brought each user).
Note: You’ll see “First user” in these dimension names. This indicates the source that brought someone to your site for the very first time, which is tracked at the user level rather than the session level.
- Your table now shows the specific source and medium combinations that originally brought users to your site, such as:
- google / organic (users who first discovered you through Google search)
- facebook / social (users who first arrived from Facebook)
- instagram / social (users who first came from Instagram)
- (direct) / (none) (users whose first visit was direct or unknown)
- Look at the New users column. This shows how many people each source brought to your business for the first time.
- For deeper investigation, especially for paid marketing, click the + icon next to the First user source/medium column header and add First user campaign as a secondary dimension to see which specific campaigns are most effective at acquiring new people.
What to Do Next (The Action)

If a source has high Sessions in the Traffic Acquisition report but low New users in the User Acquisition report
Then Diagnose the role this source plays:
- This source is effective at bringing back existing visitors but not at acquiring new people.
- Check if this is expected (like an email newsletter, which naturally reaches existing subscribers) or unexpected (like a brand awareness social media campaign that should be reaching new audiences).
- Review whether your targeting is too narrow, reaching the same people repeatedly.
And Optimise based on your goals:
- If your goal is acquisition, expand your audience targeting to reach new people rather than remarketing to existing visitors.
- If this source’s role is retention and re-engagement, consider it successful and continue investing, but don’t count on it for growth.
- Reallocate acquisition budget to sources with higher New users counts.
If organic search shows strong New users acquisition
Then Diagnose what’s working:
- This indicates your SEO efforts are successfully reaching new audiences.
- Add Landing page + query string as a secondary dimension to see which pages are best at attracting new visitors.
- Check Google Search Console to identify which search queries are bringing new people to your site.
And Optimise by expanding success:
- Create more content similar to your top-performing pages for new user acquisition.
- Optimise existing pages that rank well to capture even more new visitors.
- Ensure these high-acquisition pages have clear paths to conversion or deeper engagement.
Question 6: Which sources acquire users who eventually convert?
Behaviour: Aware → Convert
Why This Question Matters
This question reveals which channels are most effective at bringing you customers, not just traffic. Whilst session-based conversion data (Question 2) shows which sources get credit for converting visits, user-based conversion data shows which sources originally acquired those converting customers.
This distinction is crucial for accurate marketing attribution and budget decisions. A channel might not generate many immediate conversions (low session conversion credit) but could be excellent at acquiring people who eventually convert after multiple visits (high user conversion credit). Understanding this helps you avoid undervaluing top-of-funnel channels that play a critical acquisition role.
This perspective is essential for calculating true customer acquisition costs and understanding which channels are worth investing in for long-term growth, even if they don’t show immediate conversion results.
How to Find the Answer With the User Acquisition Report
You’ll continue using the User Acquisition report, focusing on conversion metrics.
- Stay in the Reports > Acquisition > User acquisition report with First user source/medium as your primary dimension.
- Scroll the table horizontally to the right until you find the Conversions column. This shows the total number of key events attributed to each source based on which channel originally brought those converting users to your business.
- To see data for one specific conversion goal, click the small dropdown arrow next to the Conversions column header and select the specific event you care about, such as purchase for an ecommerce store or generate_lead for a service business.
- You can also look at the User conversion rate column to see what percentage of users acquired by each source eventually convert, regardless of how many visits it takes.
- For ecommerce businesses, check the Total revenue column to see which acquisition sources bring the most valuable customers over time.
What to Do Next (The Action)
If a source acquires many users but has a very low User conversion rate
Then Diagnose the quality mismatch:
- This source brings volume but not the right people.
- Check if the audience targeting is too broad or if your marketing message is attracting unqualified interest.
- Cross-reference with engagement data in the Traffic Acquisition report to see if these users even engage meaningfully with your site.
And Optimise targeting and messaging:
- Narrow your audience targeting to focus on people who match your ideal customer profile.
- Revise ad creative and messaging to be more specific about what you offer and who it’s for.
- Consider whether this source might be better suited for brand awareness than direct acquisition, and adjust your goals accordingly.
- If it’s organic traffic, review which pages are attracting these users and whether you need to refine your content strategy.
Question 7: What percentage of the people I acquire eventually convert?
Behaviour: (overall) Convert | (broken down by acquisition source) Aware → Convert
Why This Question Matters
Whilst session conversion rate (Question 3) tells you what percentage of visits result in conversions, user conversion rate reveals what percentage of unique people eventually convert. This is a fundamentally different and often more strategic metric.
Many businesses have longer consideration cycles where people visit multiple times before converting. Session conversion rate might look low (because not every visit converts), but user conversion rate could be much higher (because a good percentage of people eventually convert after several visits). Understanding this helps you set realistic expectations, calculate how many new people you need to acquire to hit growth targets, and evaluate whether your funnel is effectively moving people toward conversion over time.
This metric is particularly valuable for businesses with higher-priced offerings or longer sales cycles, where immediate conversion is rare but eventual conversion is common.
How to Find the Answer With the User Acquisition Report
You’ll use the User Acquisition report to find overall and source-specific user conversion rates.
- Navigate back to Reports > Acquisition > User acquisition and look for the User conversion rate column.
- This column tells you the percentage of users acquired from each source who eventually completed a key event (conversion), regardless of how many visits it took. By default, it shows the rate for all key events combined, but you can click the dropdown arrow next to the column header to view the rate for a specific conversion like purchase or generate_lead.
- To see your overall user conversion rate across all sources, look at the total row at the bottom of the table or the summary card at the top of the report.
- The Conversions column shows the total number of users who converted after being acquired by each source.
What to Do Next (The Action)
If you want to identify your most efficient customer acquisition sources
Then Diagnose acquisition efficiency:
- Sort by User key event rate to see which sources convert the highest percentage of acquired users.
- Then look at the New users column for those same high-converting sources to understand their acquisition volume.
- Identify sources that combine both decent volume (New users) and strong conversion quality (User key event rate).
- Use the dropdown on Key events to check your most important conversion (e.g., purchase or generate_lead) to focus on your primary business goal.
And Optimise for balanced growth:
- Prioritise sources that show both acceptable User key event rates (above your median) and meaningful New users volume (enough scale to matter).
- Avoid the trap of over-investing in tiny, high-converting sources that can’t scale, or massive, low-converting sources that waste budget.
- Identify your ‘sweet spot’ sources (those in the top 25% for both User key event rate and New users) and make them your primary investment focus.
- For high-quality, low-volume sources: test expanding audience reach while monitoring whether User key event rate holds steady.
- For high-volume, low-quality sources: test audience refinement to improve User key event rate while accepting some volume reduction.
- Track the relationship between volume and quality over time as you scale to identify the point where adding more budget starts degrading user quality.
Decoding On-Site User Behaviour and Journeys
Now that you’ve mastered the fundamentals of your traffic, it’s time to dig deeper. The following questions move beyond simple counts and into the valuable analysis of what users do once they arrive on your site. This is where you uncover the “why” behind your conversion rates.
Question 8: Which pages hold attention, and which cause them to leave?
Behaviour: Review

Why This Question Matters
Before a visitor can become a customer, they must be engaged with your content and convinced of your value. This happens during the critical Review stage of their journey. This question helps you identify your “hero” content that builds trust and your “problem” pages that are leaking potential customers before they have a chance to convert.
How to Find the Answer With the Pages and Screens Report
GA4 has a dedicated report for analysing page performance.
- In the left menu, navigate to Reports > Engagement > Pages and screens.
- This report shows every page on your website (and screens if you have a mobile app).
- Focus on two key metrics in the table:
Views: This tells you how popular a page is, showing which content gets the most traffic.Average engagement time per active user: This tells you how compelling a page is. A higher time indicates that users are actively reading, watching, or interacting with your content.
- Click the header for
Average engagement time per active user. This sorts your content by its “stickiness”, revealing which articles or products hold attention the longest amongst interested visitors.
What’s an “Active User”? In GA4, an
Active Useris different from aTotal User. An Active User is someone who had an engaged session (lasting longer than 10 seconds, containing a conversion, or including at least 2 pageviews) or triggered afirst_visitevent. This filters out accidental clicks and bot traffic.
(Troubleshooting Tip: Can’t find a specific page in the report?) If you know a page is getting traffic but it isn’t appearing in this list, first double-check that your date range in the top-right corner is correct. If the date is right, the next most common cause is that the GA4 tracking code was not correctly installed on that specific page’s template. This can sometimes happen when new page designs or landing pages are launched.
What to Do Next (The Action)

If a page has high Views but low Average engagement time
Then Diagnose the content mismatch:
- Check if there’s a disconnect between the ad, link, or search result that brought visitors and what they see “above the fold” (visible without scrolling).
- Review if the headline and introduction immediately address what visitors are looking for.
- Evaluate if the page content is unclear, poorly formatted, or difficult to scan.
- Check page load speed using Google PageSpeed Insights, as slow-loading pages cause immediate abandonment even if content is good.
And Optimise the engagement experience:
- Rewrite the headline and opening paragraph to better match user intent and expectations.
- Add a compelling video near the top of the page to increase engagement time.
- Break up large text blocks with subheadings, bullet points, and visuals to improve scannability.
- Fix loading speed issues that prevent visitors from even seeing your content.
- Ensure the most important information appears above the fold, especially on mobile devices.
If a page has low Views but high Average engagement time
Then Diagnose your internal promotion strategy:
- You’ve discovered hidden gem content that deeply engages the people who find it.
- Review how visitors currently discover this page (check the “Page path and screen class” report with “Session source/medium” as secondary dimension).
- Identify why this page isn’t getting more visibility despite its quality.
And Optimise by amplifying this high-quality content:
- Add prominent links to this page from your homepage, navigation menu, and popular blog posts.
- Feature this content in your email newsletters and social media campaigns.
- Create additional content that links to this page, building “content clusters” around the topic.
- If it’s a product or service page, consider running paid advertising to drive more qualified traffic to this proven performer.
- Optimise this page for search engines to increase organic discovery.
If you identify your top 5 most-viewed pages
Then Diagnose what makes these your most important content:
- These pages represent the primary ways people experience your business online.
- Review what visitors learn about your business from each page and whether the content is comprehensive.
- Check if these pages effectively communicate your expertise, value proposition, and differentiators.
- Evaluate whether these pages naturally guide visitors to explore deeper (through internal links and related content suggestions).
And Optimise by maximizing engagement value:
- Ensure every top page has clear pathways to related, deeper content (internal links to detailed guides, case studies, or supporting articles).
- Add engaging media like videos, infographics, or interactive elements to increase time-on-page.
- Update these pages regularly to keep content fresh, accurate, and comprehensive.
- Use these pages as hubs that link to other valuable content, helping visitors discover more of your site.
- Monitor engagement trends over time to ensure these pages maintain their ability to capture and hold attention.
Note: Once you understand which pages engage visitors and where they drop off in conversion journeys, you can then optimize these high-traffic pages for conversion.
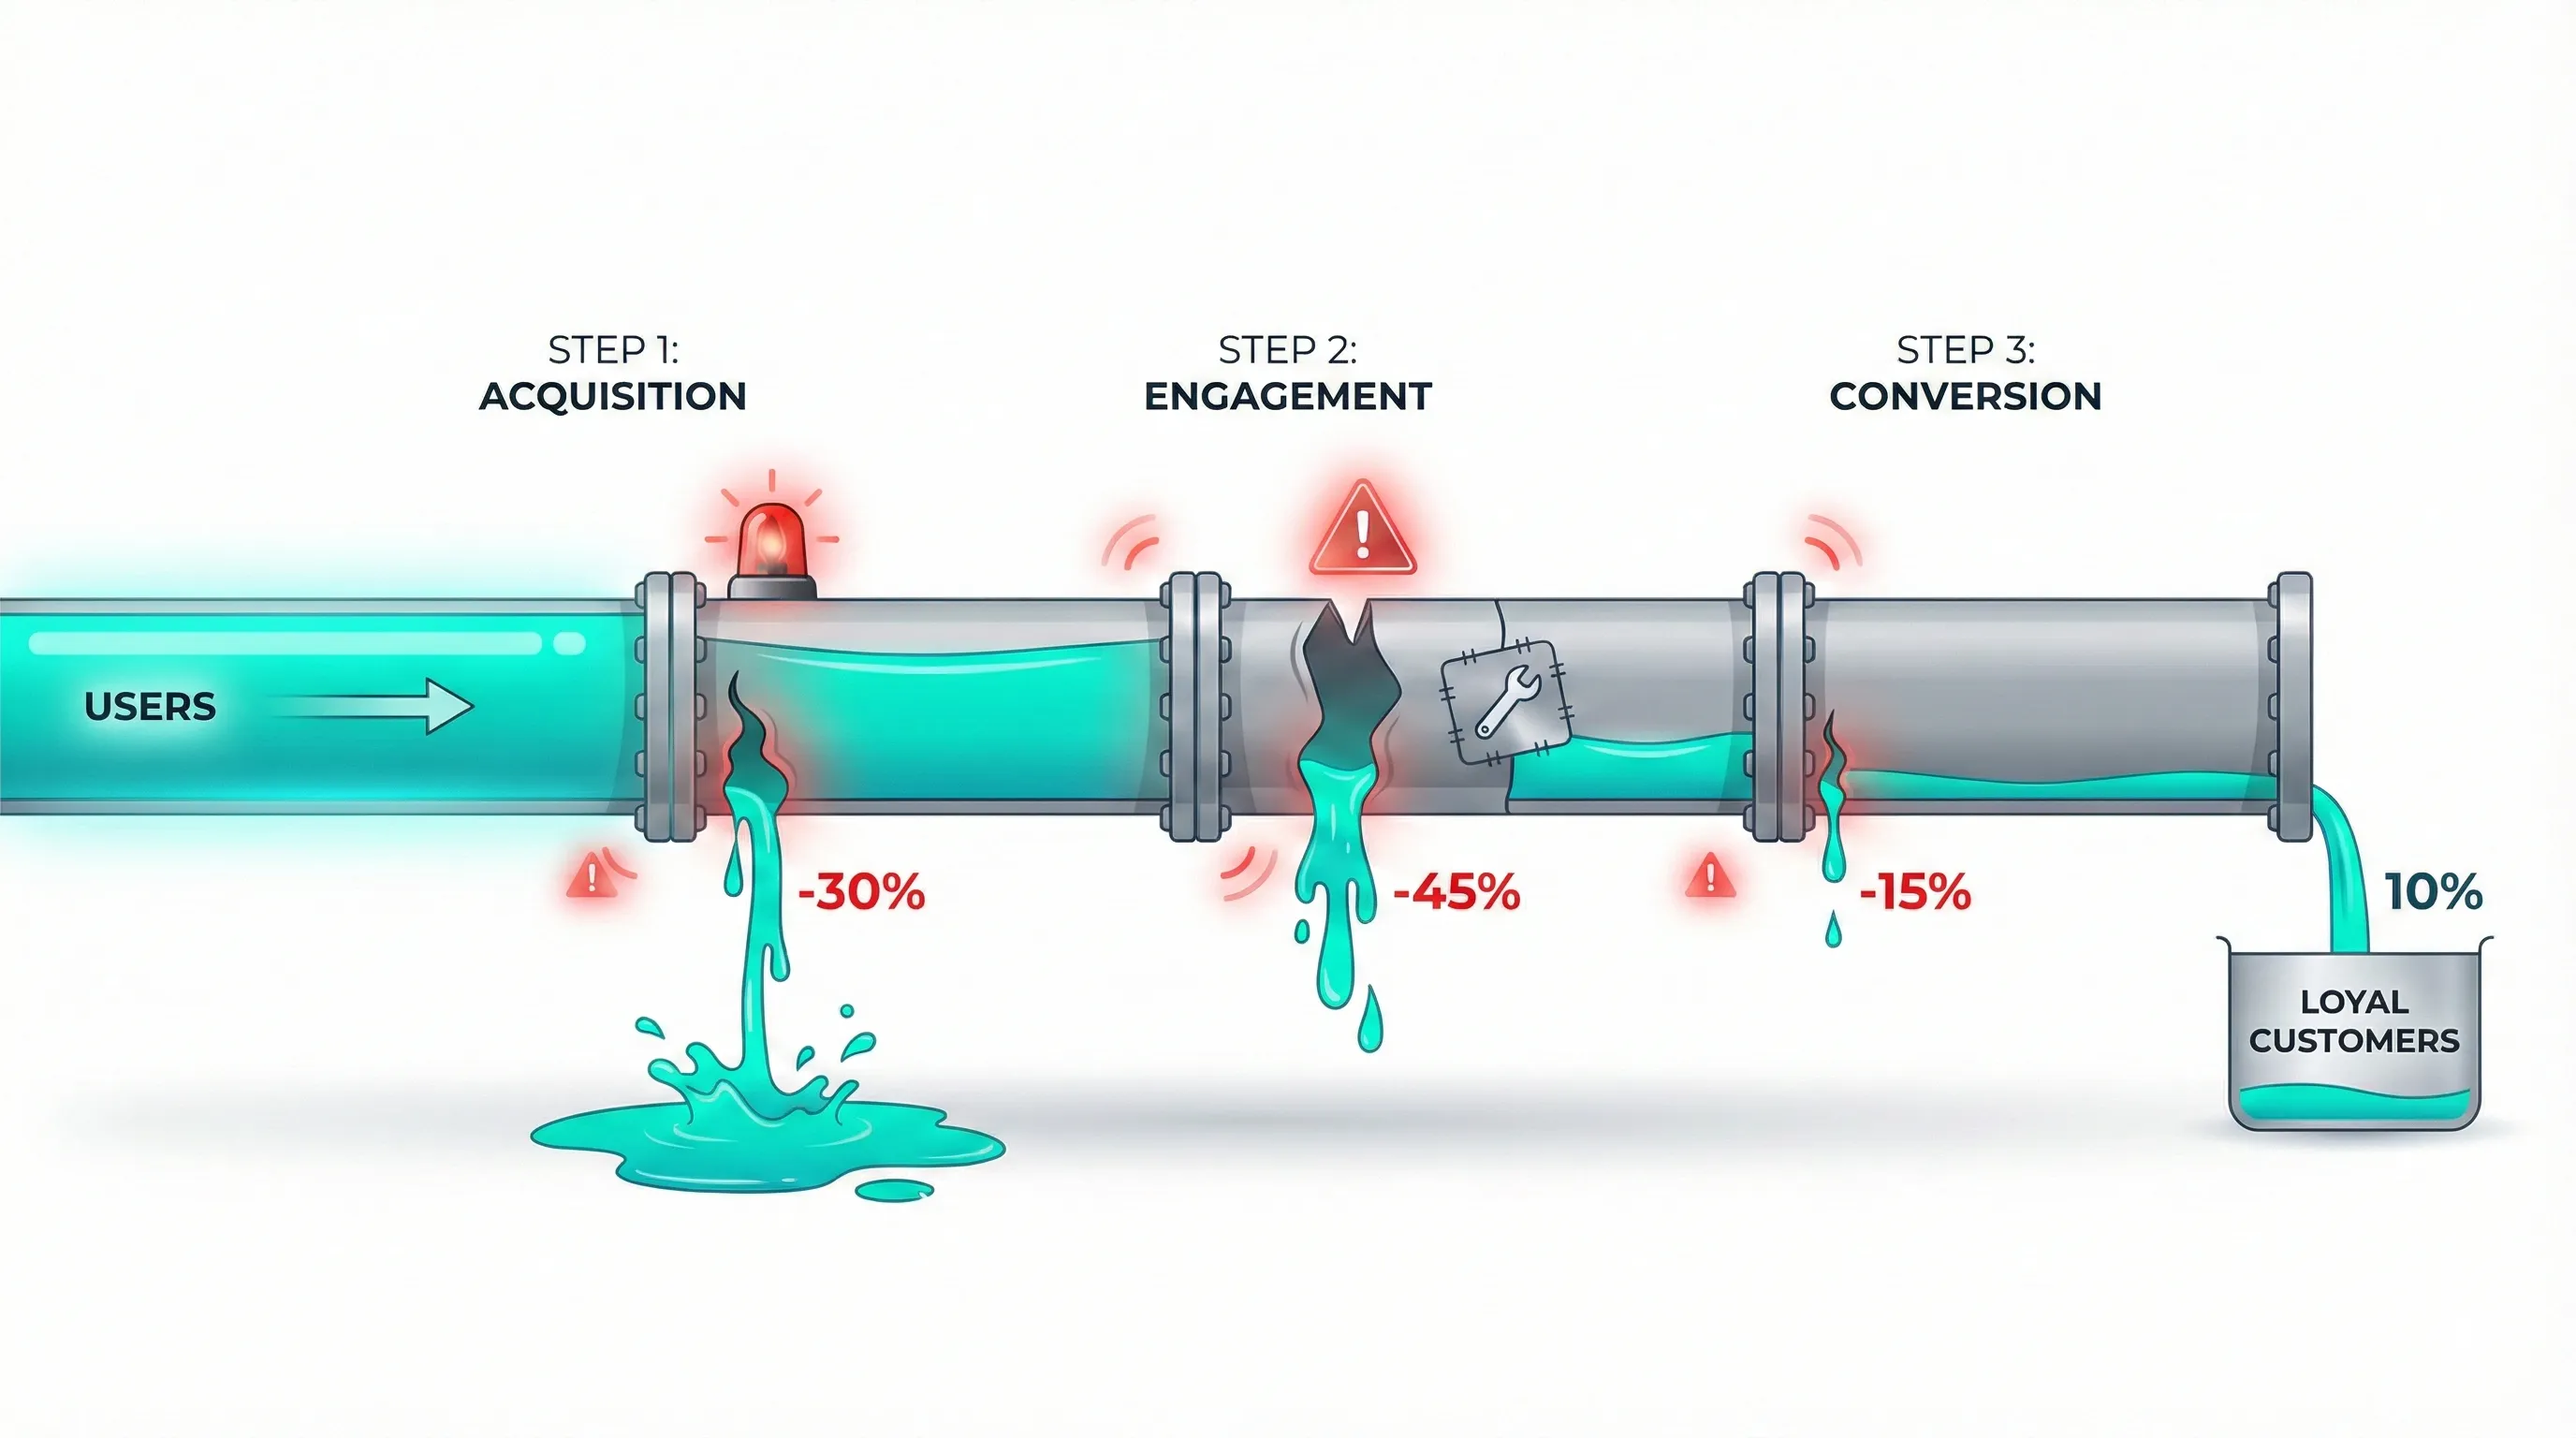
Question 9: Where are users dropping off in key journeys?
Behaviour: Review
Why This Question Matters
This question elevates your analysis from individual pages to critical processes. Whether you’re running a service business with a multi-step contact form or an ecommerce store with a checkout funnel, users follow a path to convert. Pinpointing the exact step where they abandon that path is the most direct way to fix leaks in your system and recover potentially lost revenue or leads. This is a perfect example of diagnosing a user Behaviour to improve a business Outcome.
How to Find the Answer
- In the left menu, click on Explore. In the template gallery, select Funnel exploration.
- A pre-filled template will load. In the Settings column on the left, under Steps, click the pencil icon to edit the funnel. A panel will appear on the right side showing condition options. Remove the default steps.
- Now, define the steps of your specific journey based on your business type.
Example A: Service Business Lead Generation Funnel
For a service business, a simple lead funnel might look like this:
Step 1: Name it “Visited Service Page”. For the condition:
- Click Add new condition
- Select Event > Event name
- Click Add filter and then for Condition select exactly matches (=) then click into the input field and select page_view then click Apply
- Click And > Add new condition > Page / screen > Page location
- Click Add filter and then for Condition select contains then click into the input and put
/your-service-page
Step 2: Name it “Visited Contact Page.” Condition:
- Event name is page_view, where Page location contains
/contact-us.
Step 3: Name it “Generated Lead.” Condition:
- Event name exactly matches (=) generate_lead.
Example B: Ecommerce Checkout Funnel
For ecommerce businesses, GA4 provides a dedicated, pre-built visualisation of your sales funnel that requires zero configuration. This Standard Report is the simplest way to analyse your checkout process and is recommended for all ecommerce sites using standard events.
Why use the Standard Report instead of an Exploration? The Purchase Journey report is:
- Instantly accessible: No setup required; it works immediately if you have ecommerce tracking
- Pre-configured correctly: Uses the five critical ecommerce events automatically
- Less likely to be sampled: Standard reports use pre-aggregated data tables, loading faster than Explorations
- Easier to share: Your team can access it without learning the Explore workspace
When to use a Funnel Exploration instead: If you need to track custom steps not covered by standard ecommerce events (like a specific button click or a custom event you’ve configured), then build a Funnel Exploration. But for standard checkout analysis, the Purchase Journey report is your best option.
How to Access the Purchase Journey Report
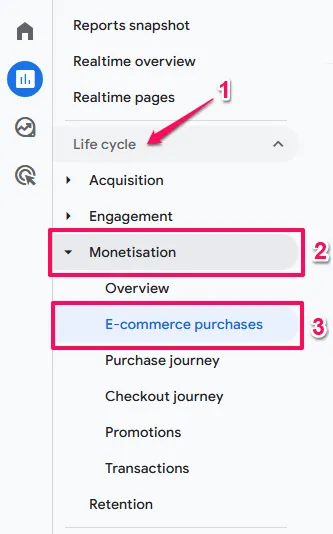
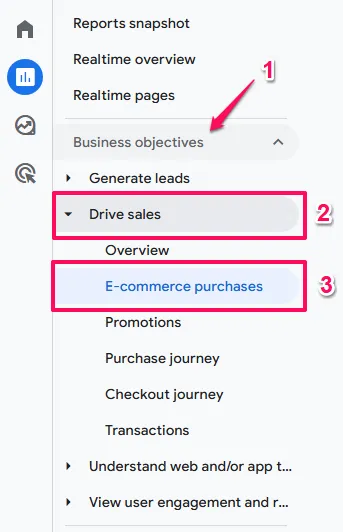
- Navigate to Monetisation: In the left navigation menu, click on Reports. Expand the Monetisation folder (or Drive sales if you are using the Business Objectives collection).
- Select the Report: Click on Purchase journey.
- Interpret the Closed Funnel: The report presents a bar chart visualising the five critical steps of the buying process:
- Session start: The total volume of traffic entering the site
- View item: The number of sessions where a specific product detail page was viewed
- Add to cart: Sessions where a user signalled intent by adding a product to their basket
- Begin checkout: Sessions that proceeded to the checkout flow
- Purchase: Sessions that resulted in a confirmed transaction
- Analysing the Drop-off: Between each bar, GA4 displays a grey arrow and a percentage. This is your Abandonment Rate.
- High drop-off between View Item and Add to Cart? This suggests your product offer, pricing, or description may be unconvincing.
- High drop-off between Begin Checkout and Purchase? This indicates friction in the payment process, such as unexpected shipping costs, lack of payment options, or technical errors.
- Advanced Segmentation: Below the chart, you’ll find a data table. By default, this may show Device category. You can click the dropdown arrow to switch this dimension to Country, Region, or Browser. This allows you to diagnose if specific segments are failing the funnel at higher rates than others (e.g., if mobile users abandon checkout significantly more than desktop users, you likely have a mobile usability issue).
Note on event requirements: This report relies on standard ecommerce events (view_item, add_to_cart, begin_checkout, purchase) that modern ecommerce platforms (like Shopify or WooCommerce) typically send to GA4 automatically. If the report is empty, verify your ecommerce tracking implementation.
What to Do Next (The Action)

Setup Issues
If the event you need is missing from the list when building your funnel
Then Diagnose your tracking setup:
- When you try to add a step for a key action (like a button click or form interaction), you might find that the event doesn’t exist in the dropdown list.
- This means that interaction isn’t being measured at all in GA4.
- Funnel analysis is only possible when you have events configured to track every critical step in your user journey.
And Optimise by implementing the missing event tracking:
- Work with your developer to implement custom event tracking for missing interactions.
- Use Google Tag Manager to set up event tracking for button clicks, form submissions, and page views.
- For ecommerce sites, ensure your platform’s GA4 integration is properly configured to track view_item, add_to_cart, begin_checkout, and purchase events.
- Document all critical user interactions that should be tracked and verify each one is firing correctly.
- Test your tracking in GA4’s DebugView before relying on the data for analysis.
Service Business Performance Issues
If you see a large drop-off at a specific step in your lead generation funnel
Then Diagnose that page or interaction carefully:
- Review the form on the drop-off step: is it too long with unnecessary fields?
- Check for technical errors like broken submit buttons or validation issues.
- Evaluate if the call-to-action is unclear or not compelling enough.
- Look for trust issues: does the page need more credibility signals like testimonials or security badges?
- Check mobile experience, as forms often have worse performance on mobile due to UX issues.
And Optimise by reducing friction:
- Simplify the form by removing non-essential fields (every field adds friction).
- Fix any technical bugs preventing form submission.
- Rewrite button text to be more persuasive and specific (e.g., “Get My Free Consultation” instead of “Submit”).
- Add trust signals near the form: privacy assurances, testimonials, or security badges.
- Improve mobile form experience with larger tap targets, appropriate keyboard types, and clear error messages.
- Consider breaking long forms into multiple steps with a progress indicator.
Ecommerce Performance Issues
If you see a large drop-off between “Added to Cart” and “Started Checkout”
Then Diagnose the cart page experience:
- Check if the cart is clearly visible and easy to find after adding items.
- Review if unexpected costs (high shipping, taxes, fees) are revealed at this stage.
- Evaluate if the “Proceed to Checkout” button is prominent enough.
- Look for missing trust signals or unclear next steps.
- Check if users can easily modify cart contents (update quantities, remove items).
And Optimise by improving the transition to checkout:
- Make the checkout button more prominent with contrasting colours and clear placement.
- Add trust badges near the checkout button (secure checkout, money-back guarantee, free returns).
- Implement a progress indicator showing how quick and simple the checkout will be.
- Show estimated shipping costs before checkout to avoid surprises.
- Add urgency elements like “Items in your cart are reserved for 15 minutes” or “Only 3 left in stock”.
- Ensure the cart is accessible and visible across all pages after items are added.
If you see a high abandonment rate between “Started Checkout” and “Completed Purchase”
Then Diagnose your checkout process thoroughly:
- Check if shipping costs are revealed too late in the process (major abandonment cause).
- Evaluate if you require account creation (guest checkout significantly improves conversion).
- Count the number of form fields: are there too many unnecessary requests for information?
- Review if payment options are limited (lack of preferred payment method causes abandonment).
- Check for technical issues like payment processing errors or unclear error messages.
- Test mobile checkout experience, as it’s typically more problematic than desktop.
And Optimise by removing checkout friction:
- Simplify checkout to a single page if possible, or clearly show progress if multi-step.
- Offer guest checkout prominently (don’t force account creation).
- Display shipping costs early in the journey or offer free shipping thresholds.
- Add multiple payment options including digital wallets (Apple Pay, Google Pay, PayPal).
- Remove unnecessary form fields; only ask for essential information.
- Add trust signals throughout checkout: security badges, return policy, customer service contact.
- Implement address auto-complete to speed up form filling.
- Show a clear order summary with product images throughout checkout.
- Ensure error messages are helpful and guide users to fix problems.
⚠️ Common Setup Issue: If you cannot find the events you need (like
generate_lead,view_item,add_to_cart,begin_checkout, orpurchase) when building your funnel, your tracking setup has a critical gap. Without these events configured, you cannot analyse user journeys or identify drop-off points. Work with your developer or ecommerce platform’s GA4 integration to implement the missing event tracking.
The Ecommerce Deep Dive
For businesses selling products online, a few specific questions can unlock massive growth. The following analysis focuses on the most critical micro-conversion in the ecommerce journey.
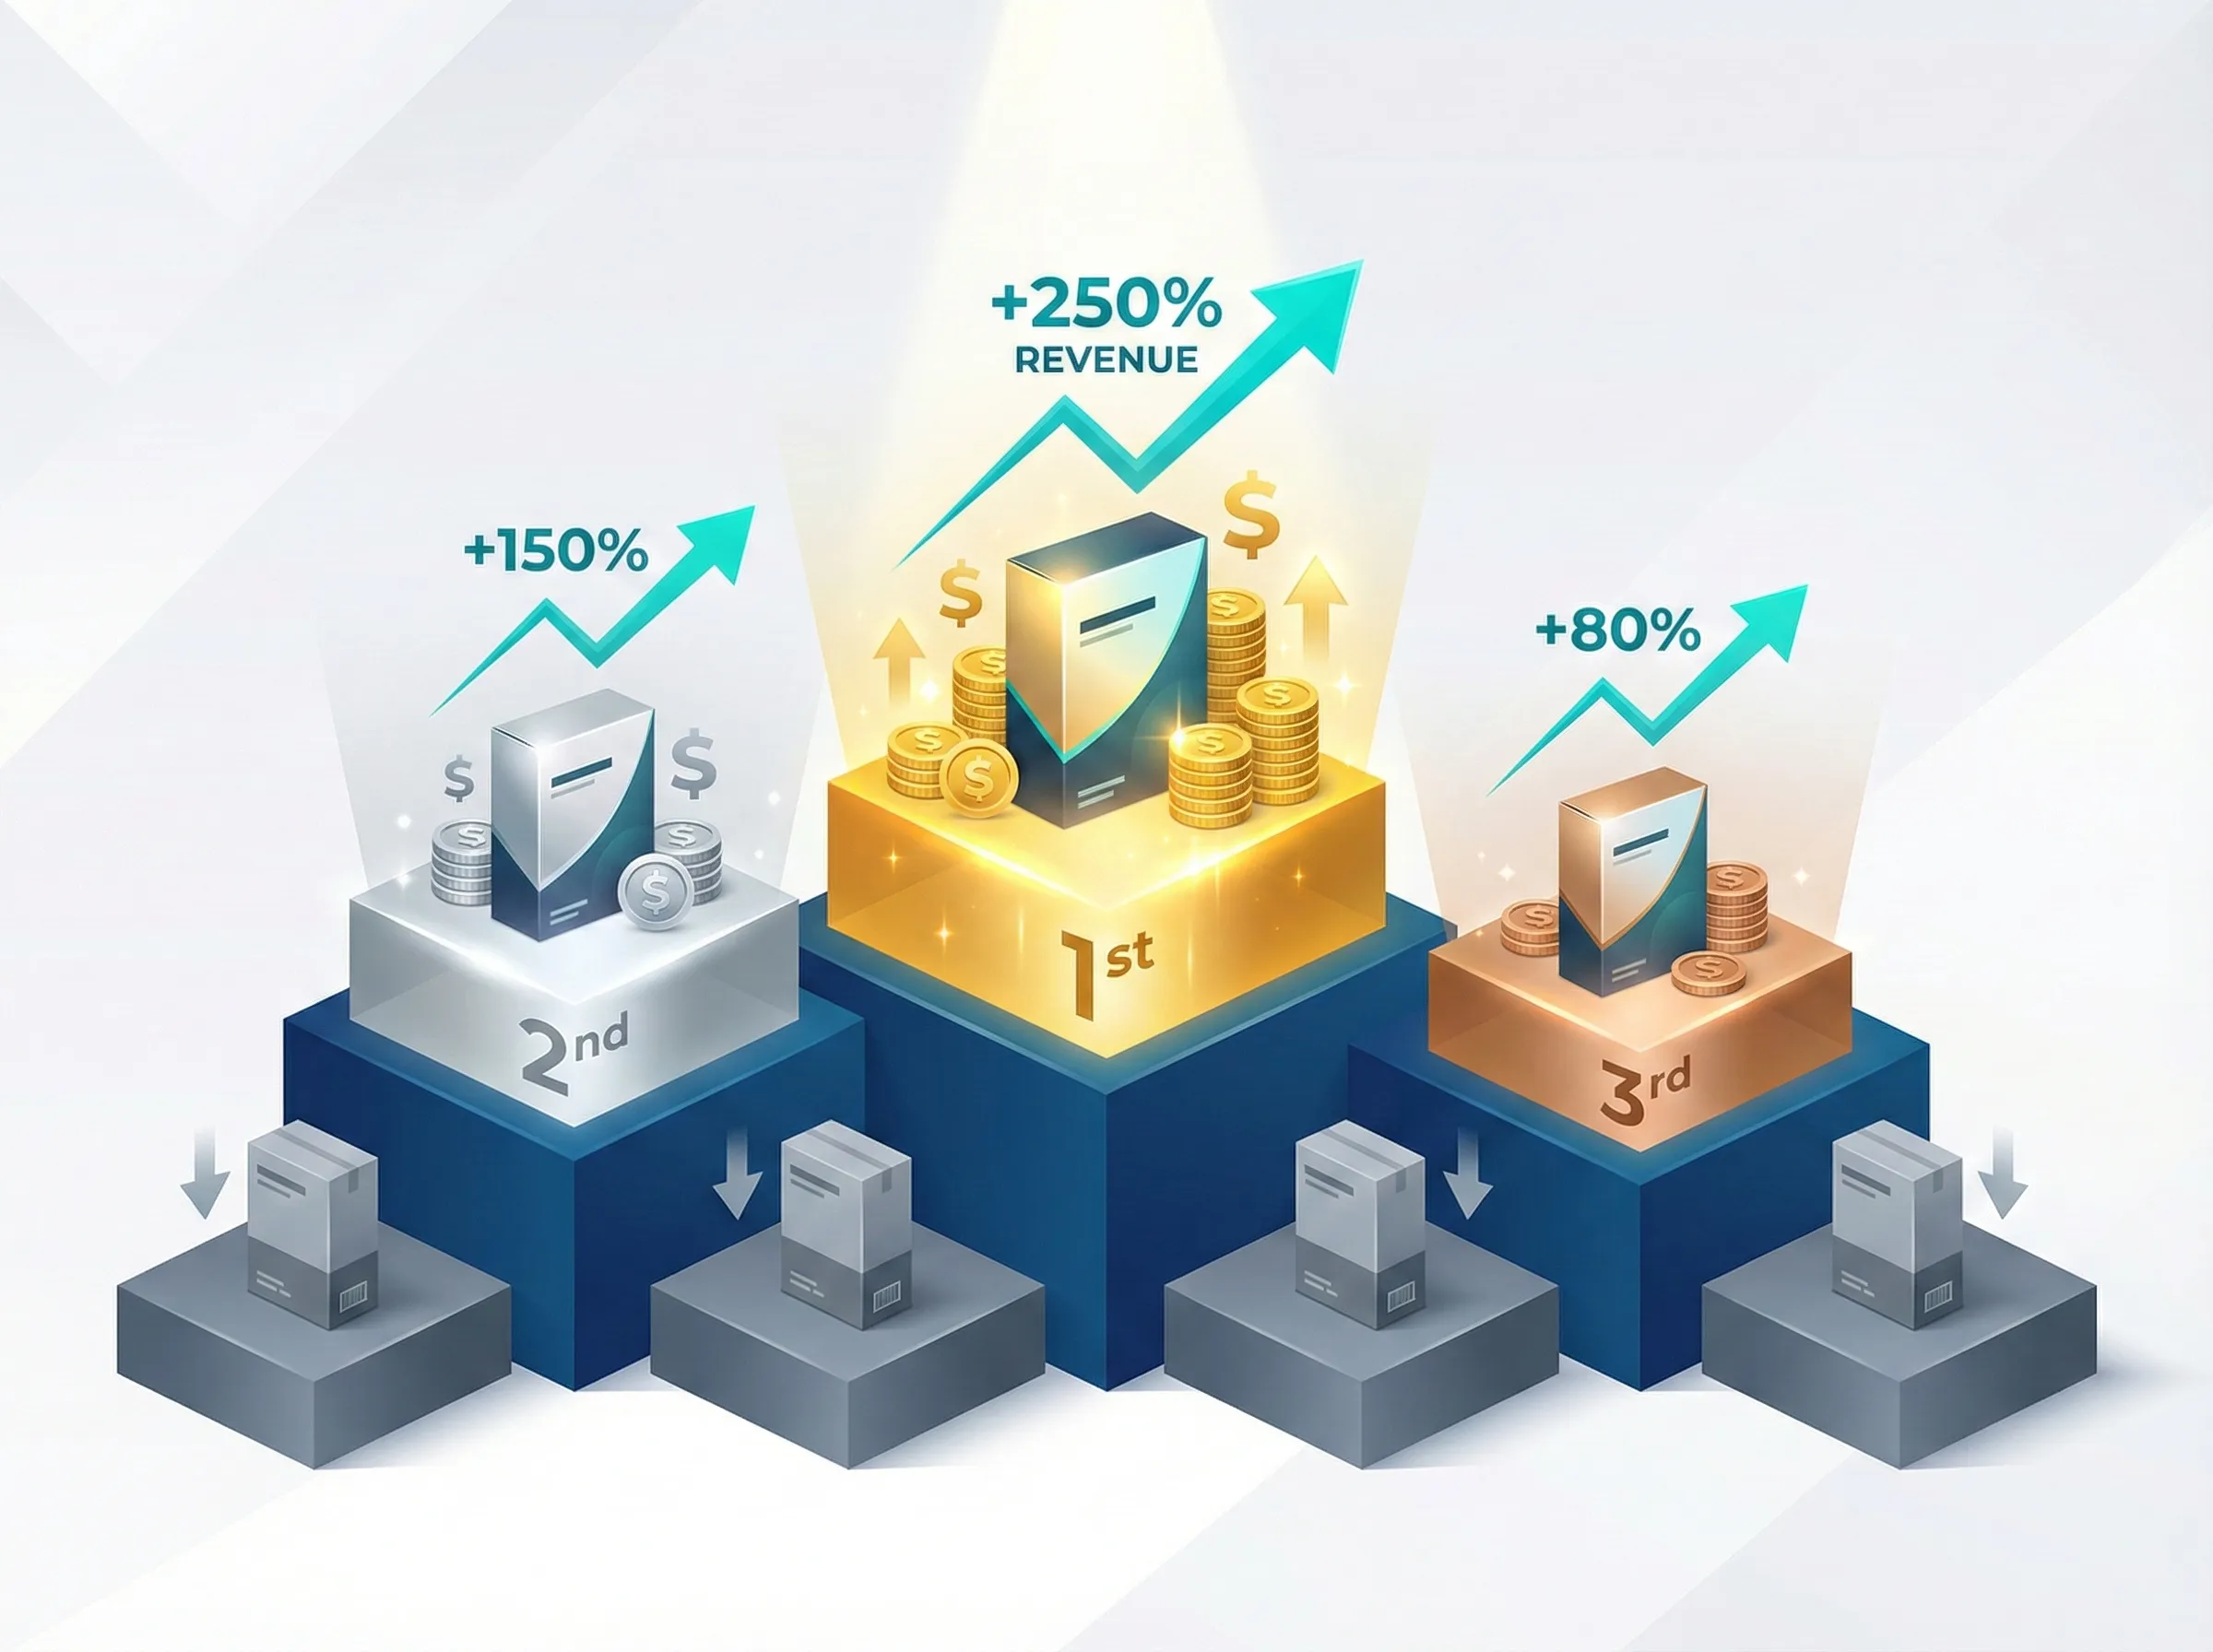
Question 10: Which products are generating the most revenue?
Behaviour: Convert
Why This Question Matters
Not all products contribute equally to your bottom line. Understanding which specific products drive the most revenue allows you to make strategic decisions about inventory, marketing budget allocation, and product development. This question helps you identify your revenue champions that deserve more promotion, as well as underperforming products that may need repositioning, price adjustments, or discontinuation. It shifts your focus from vanity metrics like total product views to what actually matters: revenue generation.
How to Find the Answer
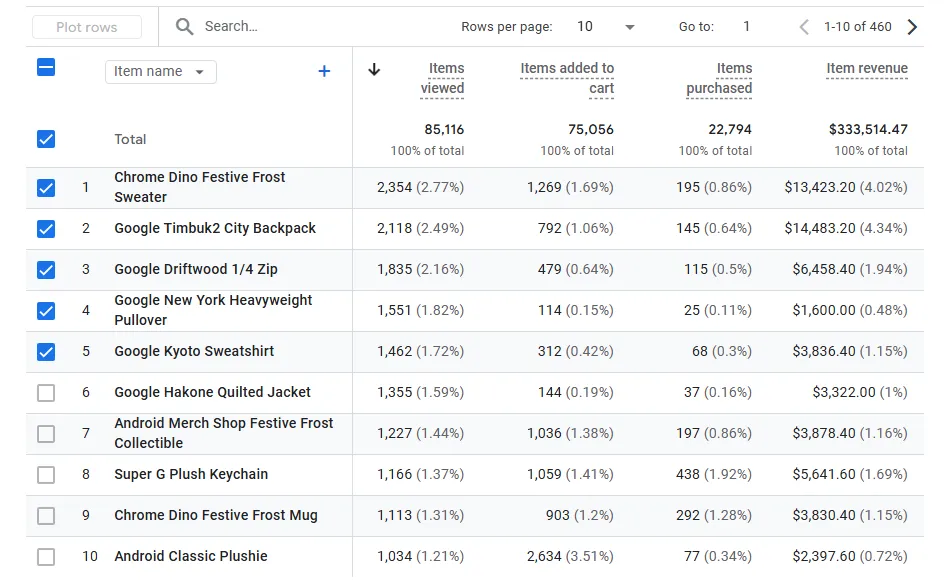
- In the left menu, navigate to Reports > Monetization > Ecommerce purchases.
- The default view shows your ecommerce overview metrics at the top. Scroll down to the data table.
- Click the dropdown arrow on the primary dimension (it may show “Item name” by default, which is exactly what we want). If it shows something else, change it to Item name.
- The table now displays each product with key metrics:
- Item revenue: The total revenue generated by this product
- Items purchased: How many units were sold
- Item views: How many times the product page was viewed
- Click on the Item revenue column header to sort by highest revenue first. This instantly shows you your top-performing products.
What to Do Next (The Action)
Setup Issues First
If the Items viewed column shows zeros or (not set) despite knowing people visit your product pages:
Then Diagnose your event tracking:
This analysis requires the view_item event to be firing on your product detail pages. In many custom GA4 implementations (particularly non-Shopify/WooCommerce setups), developers might implement the purchase event but forget the view_item event.
And Optimise by implementing missing events:
- Check your GA4 ecommerce implementation documentation for your platform
- Work with your developer to ensure view_item fires when product pages load
- Verify in GA4’s DebugView (Admin > DebugView) that the event appears when you visit a product page
- Wait 24-48 hours after implementation before analysing this report
Once you’ve confirmed view_item tracking is working, you can proceed with the analyses below.
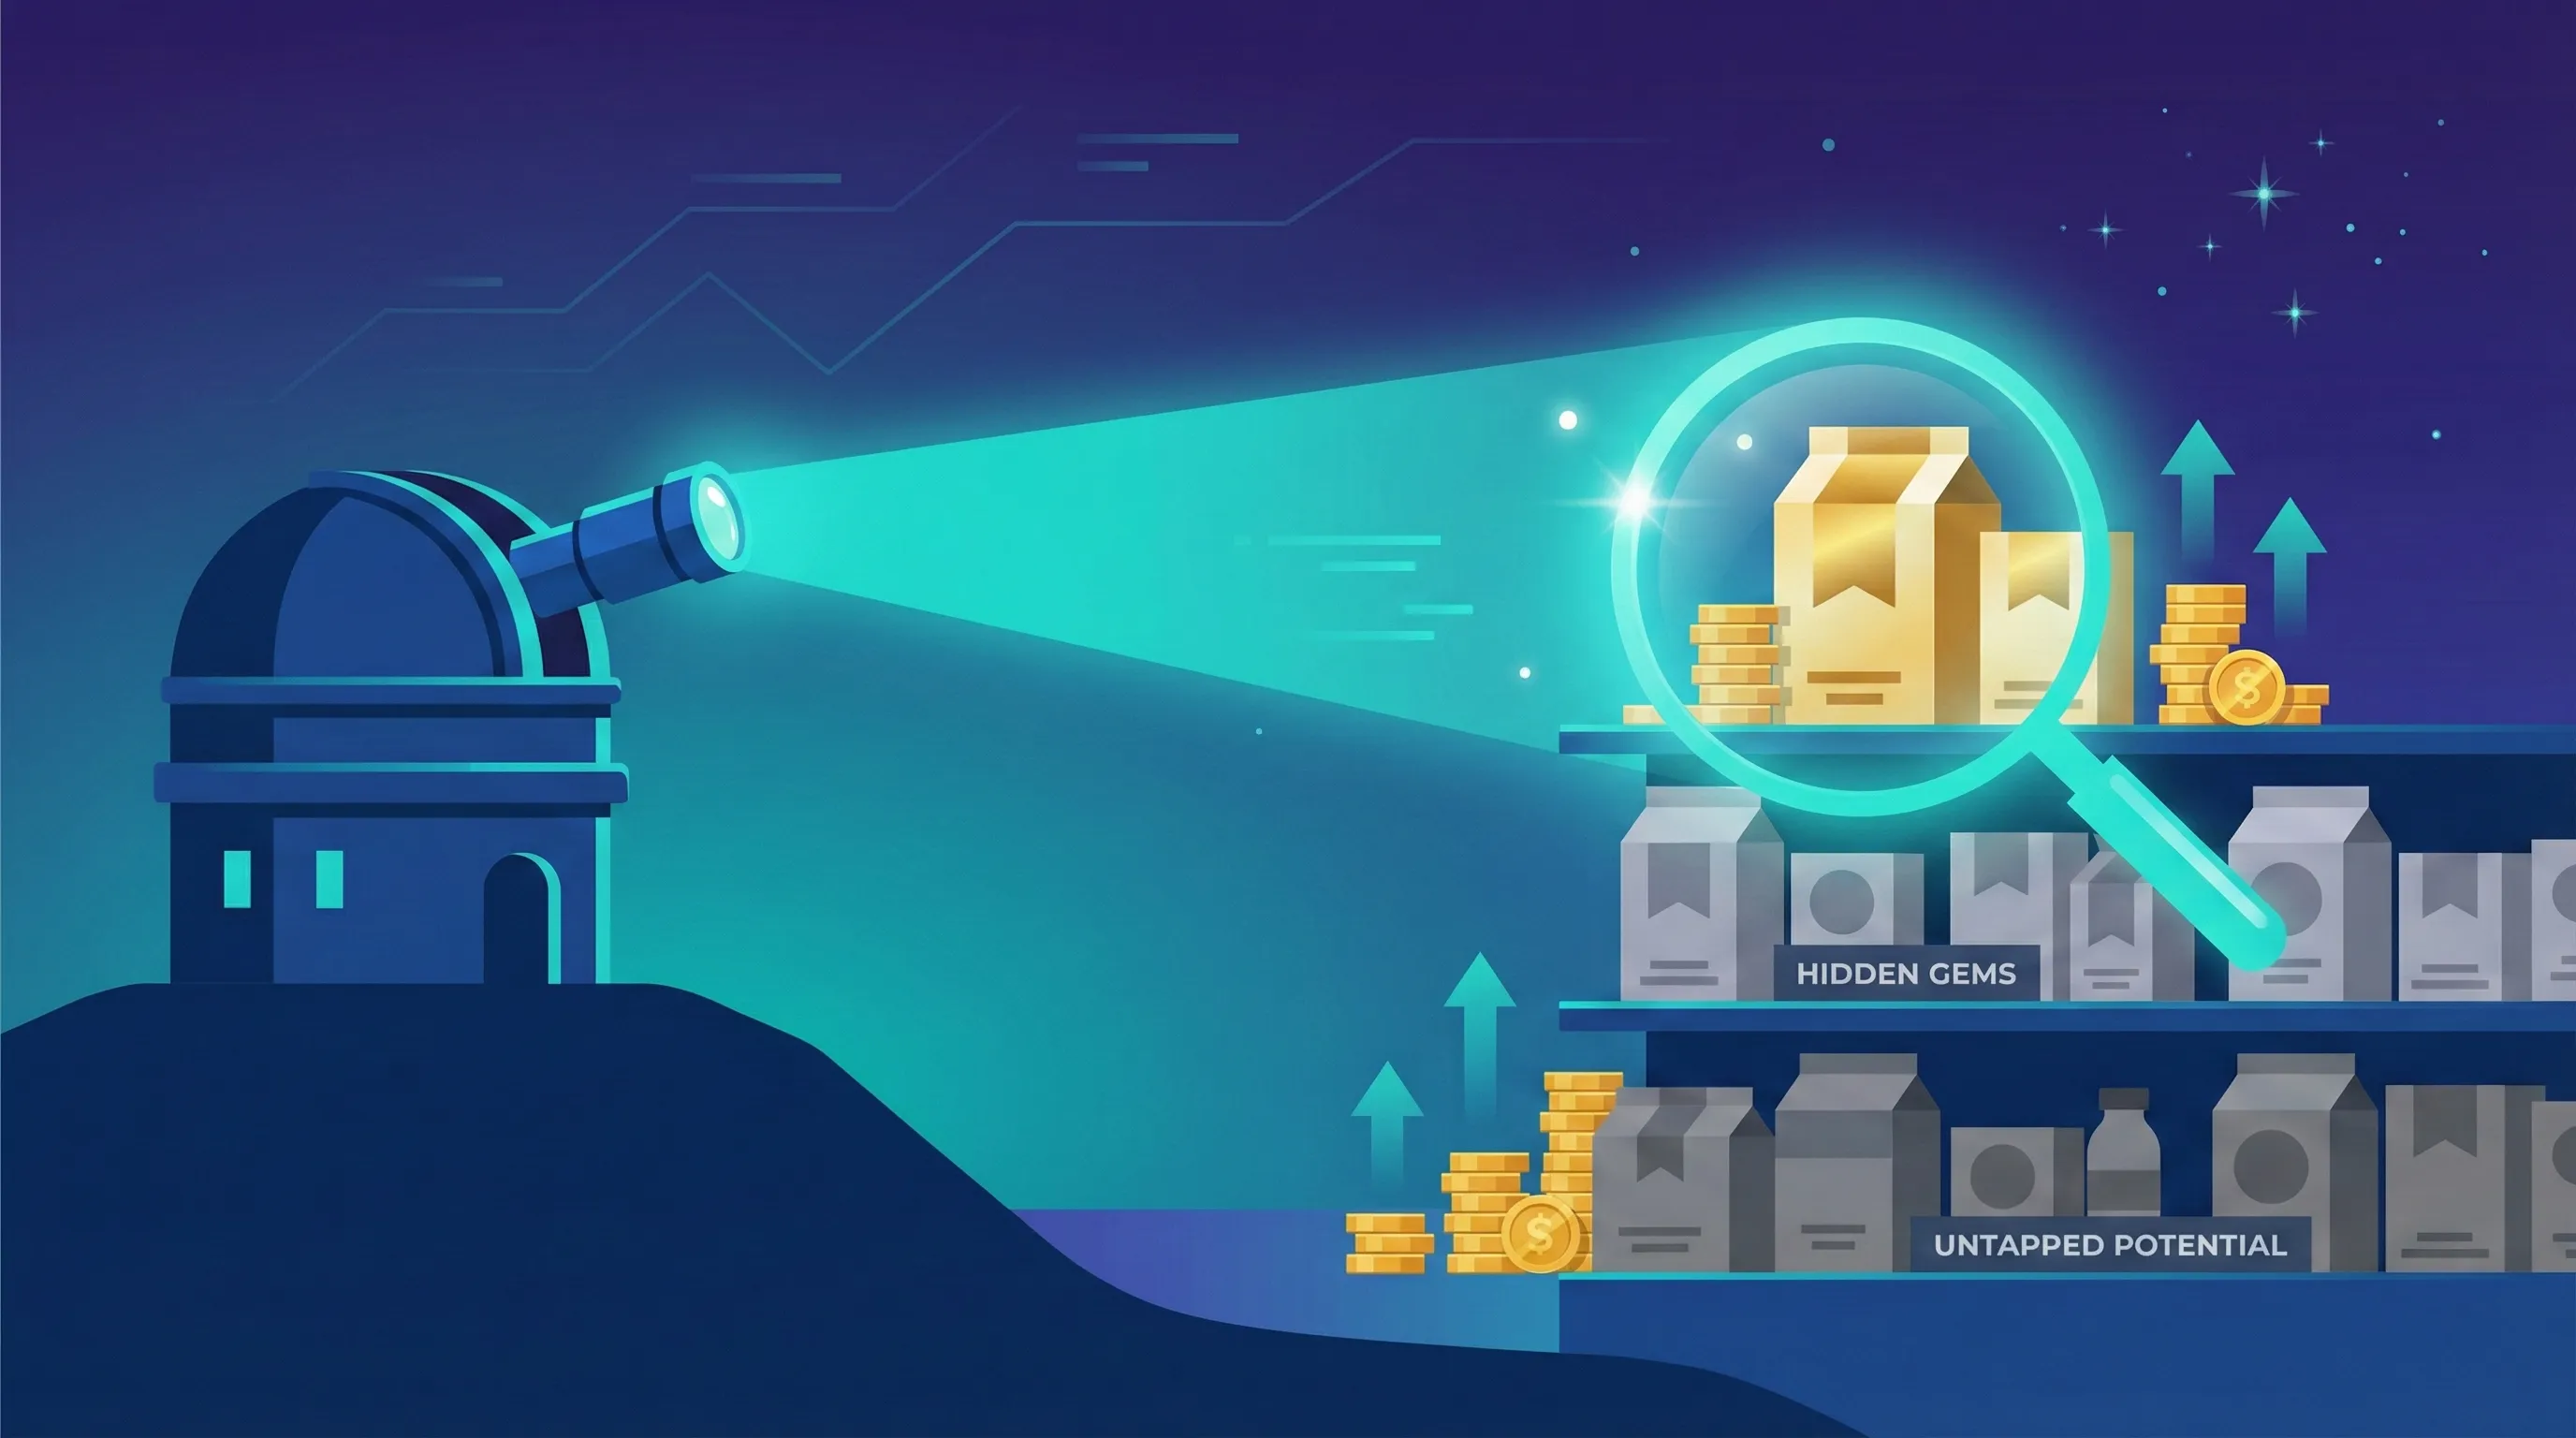
Discovering Hidden Gems
If a product has low Item views but high Items purchased when viewed
Then Diagnose the product discovery problem:
- This product converts well but isn’t being seen by enough potential customers.
- Check where this product appears in your site navigation and category pages.
- Review your internal site search to see if people searching for related terms find this product.
- Evaluate if the product name or description uses terms customers actually search for.
And Optimise by improving product visibility:
- Feature this hidden gem more prominently in navigation menus and category pages.
- Cross-sell this product on related product pages (in “You may also like” or “Frequently bought together” sections).
- Promote this product through targeted email campaigns to relevant customer segments.
- Create blog content or buying guides that naturally feature and link to this product.
- Improve product title and description with keywords customers use when searching.
- Add this product to your homepage carousel or featured products section.
- Run paid advertising campaigns specifically highlighting this high-converting product.
Monitoring Trends
If you see a high-revenue product with declining performance over time
Then Diagnose the cause of the decline:
- Use the date comparison feature (click the date range in the top-right and select “Compare to: Previous period”) to identify when the decline started.
- Check if the decline is seasonal (common for certain product categories).
- Research if increased competition or new alternatives have entered the market.
- Review recent changes to the product, pricing, or product page that might explain the drop.
- Look at customer reviews to see if product quality has declined or expectations have shifted.
And Optimise based on the root cause:
- If seasonal, plan inventory and marketing around these cycles; don’t panic during natural dips.
- If facing new competition, run a promotional campaign to revive interest and recapture market share.
- If the product itself is declining in relevance, consider whether it’s time to develop an updated version or replacement.
- Refresh the product page content with new imagery, updated descriptions, and current customer reviews.
- Test price adjustments or bundle offers to make the product more attractive.
- Survey customers who recently purchased to understand if satisfaction has changed.
⚠️ Common Setup Issue: If the Ecommerce purchases report is empty or shows no data, your GA4 ecommerce tracking isn’t configured. This prevents you from analysing product performance, revenue attribution, and purchase behaviour. You need to implement GA4 ecommerce events following your platform’s integration guide (Shopify, WooCommerce, etc.).
The Service Business Deep Dive
For businesses that sell services, the goal is not an immediate transaction but to build trust and generate qualified leads. Content is the engine of this process, and the following question helps you measure its effectiveness.
Question 11: Which informational content is most effective at generating leads?
Behaviour: Review → Convert
Why This Question Matters
Unlike ecommerce, service-based businesses often have a longer sales cycle that relies on demonstrating expertise and building credibility. The user journey is educational, not transactional. This question connects your content marketing efforts – like blog posts, case studies, and whitepapers – directly to your primary business outcome: generating qualified leads. It is the key to proving the ROI of your content.
How to Find the Answer
For this, we will use another powerful tool in the Explore section called Path exploration, which allows us to work backward from a conversion.
- In the left menu, click Explore and select the Path exploration template.
- In the exploration settings on the left, look for the “Starting point” dropdown and change it to Ending point.
- For the node type, select Event name from the dropdown, then choose your primary lead conversion event, which is typically generate_lead.
- The visualisation will now show Step -1, which represents the actions users took immediately before they submitted the form. The path flows backward from your conversion event.
- By default, this step may show
Event name. Click on the node type dropdown and change it to Page path and screen class. This will now show you the URLs of the specific pages users were on right before they converted, revealing your most persuasive content. - The first step backward from a conversion (Step -1) is often the page where the conversion event fired (e.g., the /contact page for a contact form submission). To find the influencing content that led to the conversion, you may need to look at Step -2 or Step -3 in the path. However, if your conversion event is a form submission that happens directly on a content page (like a newsletter signup embedded in a blog post), Step -1 will show the content page itself.
What to Do Next (The Action)

Setup Issues
If you cannot find a generate_lead event (or similar form submission event) to select as your ending point
Then Diagnose your conversion tracking gap:
- This means you are not tracking your most important business outcome.
- Without tracking form submissions, you cannot prove the value of your content marketing or identify which articles drive leads.
- This analysis is impossible without proper conversion tracking.
And Optimise by implementing form submission tracking:
- Check if Enhanced Measurement is enabled in GA4 (Admin > Data Streams > select your stream > Enhanced Measurement).
- If Enhanced Measurement is on and forms still aren’t tracked, you may need custom event tracking via Google Tag Manager.
- Work with your developer to ensure every lead form submission fires a generate_lead event.
- Test form submissions in GA4’s DebugView to verify events are firing correctly.
- Mark the generate_lead event as a key event (Admin > Data display > Events > toggle star icon).
- Wait 24-48 hours after implementation before expecting data to appear in reports.
Content Performance Issues
If a blog post receives high traffic but rarely appears in the reverse path report
Then Diagnose the call-to-action (CTA) problem:
- This content attracts visitors but fails to convert them into leads.
- Check if there’s even a CTA on the page or if it’s a generic “Contact Us” link.
- Review if the CTA is buried at the very bottom of a long article where few readers reach.
- Evaluate whether the CTA is relevant to the content topic or feels like a disconnected sales pitch.
And Optimise by strengthening the conversion opportunity:
- Rewrite the CTA to be specific and relevant to the article’s topic (e.g., “Get a Free Consultation on [Article Topic]” instead of generic “Contact Us”).
- Add the CTA higher up on the page, ideally after the introduction and again mid-article, not just at the end.
- Create content upgrades (downloadable guides, checklists, templates) related to the article topic that require email submission.
- Use inline CTAs within the content that feel natural rather than just a form at the bottom.
- Test different CTA formats: buttons vs. text links, popups vs. inline forms, exit-intent vs. scroll-triggered.
- Add social proof near the CTA (testimonials, number of downloads, customer logos).
If the path report shows users visit many pages before converting
Then Diagnose your content funnel:
- Users are researching extensively before becoming leads, indicating a longer consideration cycle.
- Review the typical sequence of pages (educational content → service pages → case studies → conversion).
- Identify if there are common patterns in the multi-page journey.
- Check if users are finding answers to their questions across multiple articles or if information is scattered.
And Optimise your content strategy for the multi-touch journey:
- Create clear content pathways that guide users from awareness to consideration to decision.
- Use internal linking to connect related articles and guide readers toward high-converting content.
- Develop content for each stage: awareness (educational blog posts), consideration (detailed guides, comparisons), decision (case studies, pricing, testimonials).
- Add “next step” CTAs throughout content that move readers deeper into the funnel (e.g., “Ready to learn more? Check out our guide on [next topic]”).
- Implement email capture early in the journey so you can nurture leads through multiple touchpoints.
- Consider that not every page needs an aggressive lead form; some should focus on building trust and moving users to the next stage.
- Track and optimize the entire content funnel, not just individual articles in isolation.
Next Steps
Understanding the Approach You Just Used
This guide followed the Actionable Measurement Framework: you started with business outcomes and user behaviors (not tools), which informed the right questions to ask. Those questions mapped to the user journey (Aware, Review, Convert), you found answers in GA4 data, then took action using “If trigger, Then Diagnose, And Optimise” protocols.
This systematic approach makes measurement actionable rather than just informative. The questions weren’t arbitrary—they connected directly to how users discover, evaluate, and convert, ensuring you measure what actually drives growth.
Fix Any Issues Discovered in Your Measurement Foundation
As you worked through these questions, you likely discovered gaps where critical data simply doesn’t exist: UTM tracking missing, key events not configured, ecommerce tracking broken, or form submissions not captured. These discoveries show you exactly what needs fixing to unlock GA4’s full value.
What to address first: If you couldn’t answer Questions 1-3 (traffic sources, conversions, conversion rates), your foundational tracking is incomplete. Start with How to Build Your Marketing Measurement Foundation, which walks through implementing Google Tag Manager, GA4 event tracking, UTM parameters, and conversion tracking—the complete infrastructure needed to answer every question in this guide.
If specific components are missing: UTM parameters enable Question 1’s campaign-level analysis. Key event configuration unlocks Questions 2-3’s conversion tracking. Ecommerce events power Question 10’s revenue analysis. Form submission tracking enables Question 11’s lead attribution. The Foundation guide shows you how to implement each component correctly.
Use Looker Studio to Create a Single Dashboard
Answering these questions in GA4 requires navigating multiple reports, sorting columns, and switching dropdowns repeatedly. Looker Studio transforms this by creating a single dashboard that answers all your critical questions at a glance, saving hours weekly and making trends immediately obvious.
Rather than building from scratch, use The Actionable Google Marketing Looker Studio Dashboard. This free template connects your GA4 data (ecommerce and lead generation), Google Ads, and Google Search Console into one unified view built on the same Framework that guided this guide’s questions.
Pair GA4 With User Experience Analytics
GA4 shows you what users do (pages visited, traffic sources, conversions) but cannot show you how they interact with pages or why they behave certain ways. User experience tools like Microsoft Clarity complement GA4 by providing heatmaps, session recordings, and form analytics.
Use both together: GA4 identifies problem areas (low engagement pages, funnel drop-offs), UX analytics diagnoses why (watch recordings, view heatmaps), you make targeted improvements, then GA4 measures impact. Learn more: Microsoft Clarity vs Google Analytics.
Understanding the Complete Measurement System
This guide showed you how to extract insights from GA4, but GA4 is one component of a complete measurement infrastructure. The questions you answered require proper event tracking, UTM parameters for attribution, conversion configuration across platforms, and unified reporting. When one component is misconfigured, you get incomplete answers or no answers at all.
How to Build Your Marketing Measurement Foundation shows you how these components work together—Google Tag Manager for deployment, the data layer for structured tracking, GA4 for analytics processing, UTM parameters for attribution, conversion tracking for optimization, and Looker Studio for unified reporting—creating a system where every question has a reliable answer.
If You Need Help
Fixing GA4 configuration gaps requires implementing event tracking, UTM parameters, conversion setup across platforms, ecommerce tracking, and cross-channel attribution. Our Marketing Measurement Foundation service provides complete implementation with proper event architecture and conversion tracking if you prefer expert setup.
Conclusion: From Data to Decisions
By starting with clear business questions, you have successfully navigated Google Analytics 4 with purpose. You’ve moved from simple traffic analysis to understanding complex user behaviour, identifying your most valuable marketing channels, and pinpointing opportunities to improve your website’s performance. This is the core of an effective measurement strategy: it’s not about becoming a GA4 expert, but about becoming an expert in what drives your own business forward.
You now have a repeatable framework for turning data into decisions. You’ve also likely uncovered a few gaps in your setup where the data you need simply isn’t available yet. This is a natural and valuable part of the process, as it shows you exactly what needs to be fixed to get a complete picture of your business.
For those who are ready to move from this manual analysis to an automated, custom measurement strategy that’s perfectly tailored to your business goals, the next step is building your own Actionable Measurement Plan. This ensures all your data is tracked correctly from day one and delivered in clear, simple dashboards, so you can spend less time digging for answers and more time taking action.